
Track the world’s most-visited websites, industries, and monthly trends across 10K+ domains.
Artificial intelligence is no longer just another technology trend. If you have used the internet today, there is a good chance you have already used AI without thinking much about it.
Maybe you asked ChatGPT a question instead of searching Google. Perhaps Canva helped you design a presentation, Claude drafted an email, or Google Translate translated a webpage while you were browsing.
Just a few years ago, these tools were mainly used by early adopters. Today, they are becoming part of how millions of people work, learn, create, and solve everyday problems.
That naturally raises a few questions.
How large has the AI tools market become? Is growth still accelerating? Which platforms are gaining ground, and which are losing users? Which categories are changing fastest? And how significant is AI when compared with the internet as a whole?
To answer those questions, we analyzed 9,531 AI tools across more than 170 categories using data from OneLittleWeb’s AI Tools Dashboard. Combining monthly web visit estimates from Semrush and Ahrefs, we examined 24 months of traffic data from May 2024 to April 2026 and compared the latest 12 months with the previous year.
What we found was a market that is not only growing, but becoming increasingly concentrated.
Together, the AI tools in this study generated 144.5 billion web visits over the past 12 months, up 40.12% year over year. The Top 100 AI tools alone accounted for 129.6 billion visits, grew 49.94%, and captured 89.69% of all AI tool web visits we tracked.
Put another way, nearly 9 out of every 10 visits to an AI tool now go to just the top 100 AI tools.
But we also wanted to see how large AI is compared with the web visits of all the most popular websites.
OneLittleWeb’s Most Popular Websites in the World Dashboard tracks 10,173 major websites across every industry, including the AI tools in this study. Together, those websites generated 3.44 trillion visits during the same period. AI tools accounted for 144.5 billion, or 4.20% of all tracked web traffic.
That comparison tells a clear story.
Within its own market, AI is expanding quickly and concentrating around a small group of leaders. Yet against the internet as a whole, it still represents a relatively small share of total activity, leaving plenty of room for further adoption.
In the sections ahead, we will show which AI tools dominate the market, which platforms and categories are gaining or losing momentum, which countries are adopting AI fastest, and what these trends reveal about where the industry may be heading next.
A snapshot of the study's biggest insights, including market size, growth, concentration, category leaders, and the trends shaping AI adoption.
See the complete Top 100 ranking alongside a visual summary of the market’s biggest tools, growth patterns, web visit totals, and market share.
A closer look at the world's 20 most-visited AI tools, including their traffic trends, market position, and what their growth or decline reveals.
Explore the largest AI categories by web traffic, then see the top-performing tools within each category and how the competitive landscape is evolving.
Discover which AI tools and categories gained the most momentum over the past year, which lost ground, and the trends driving those changes.
Compare AI adoption across countries using web visits per 100,000 people to identify where AI usage is most deeply embedded.
This study measures estimated web visits, not unique users, revenue, subscriptions, app usage, or API usage. Web visits are useful for comparing public demand and discovery patterns across tools, but they do not capture every way people use AI products. Some tools in this study are comprehensive software products with significant AI features, including Salesforce, Zoom, Canva, and HubSpot. These tools are included because AI functionality is a core component of the overall product experience or classification.
After looking at the full AI tools market, we wanted to zoom in on the platforms that captured most of the demand.
Out of the 9,531 AI tools in our dataset, the Top 100 generated 129.6 billion web visits from May 2025 to Apr 2026. That equals 89.69% of all AI tool web visits we tracked, making the Top 100 the clearest window into where user attention is actually going.
The infographic below focuses on those 100 tools. It shows the ranking by total web visits, the concentration of visits among the largest platforms, the monthly growth trend of the Top 100, the categories driving the most visits inside the ranking, and the countries where AI adoption is highest.
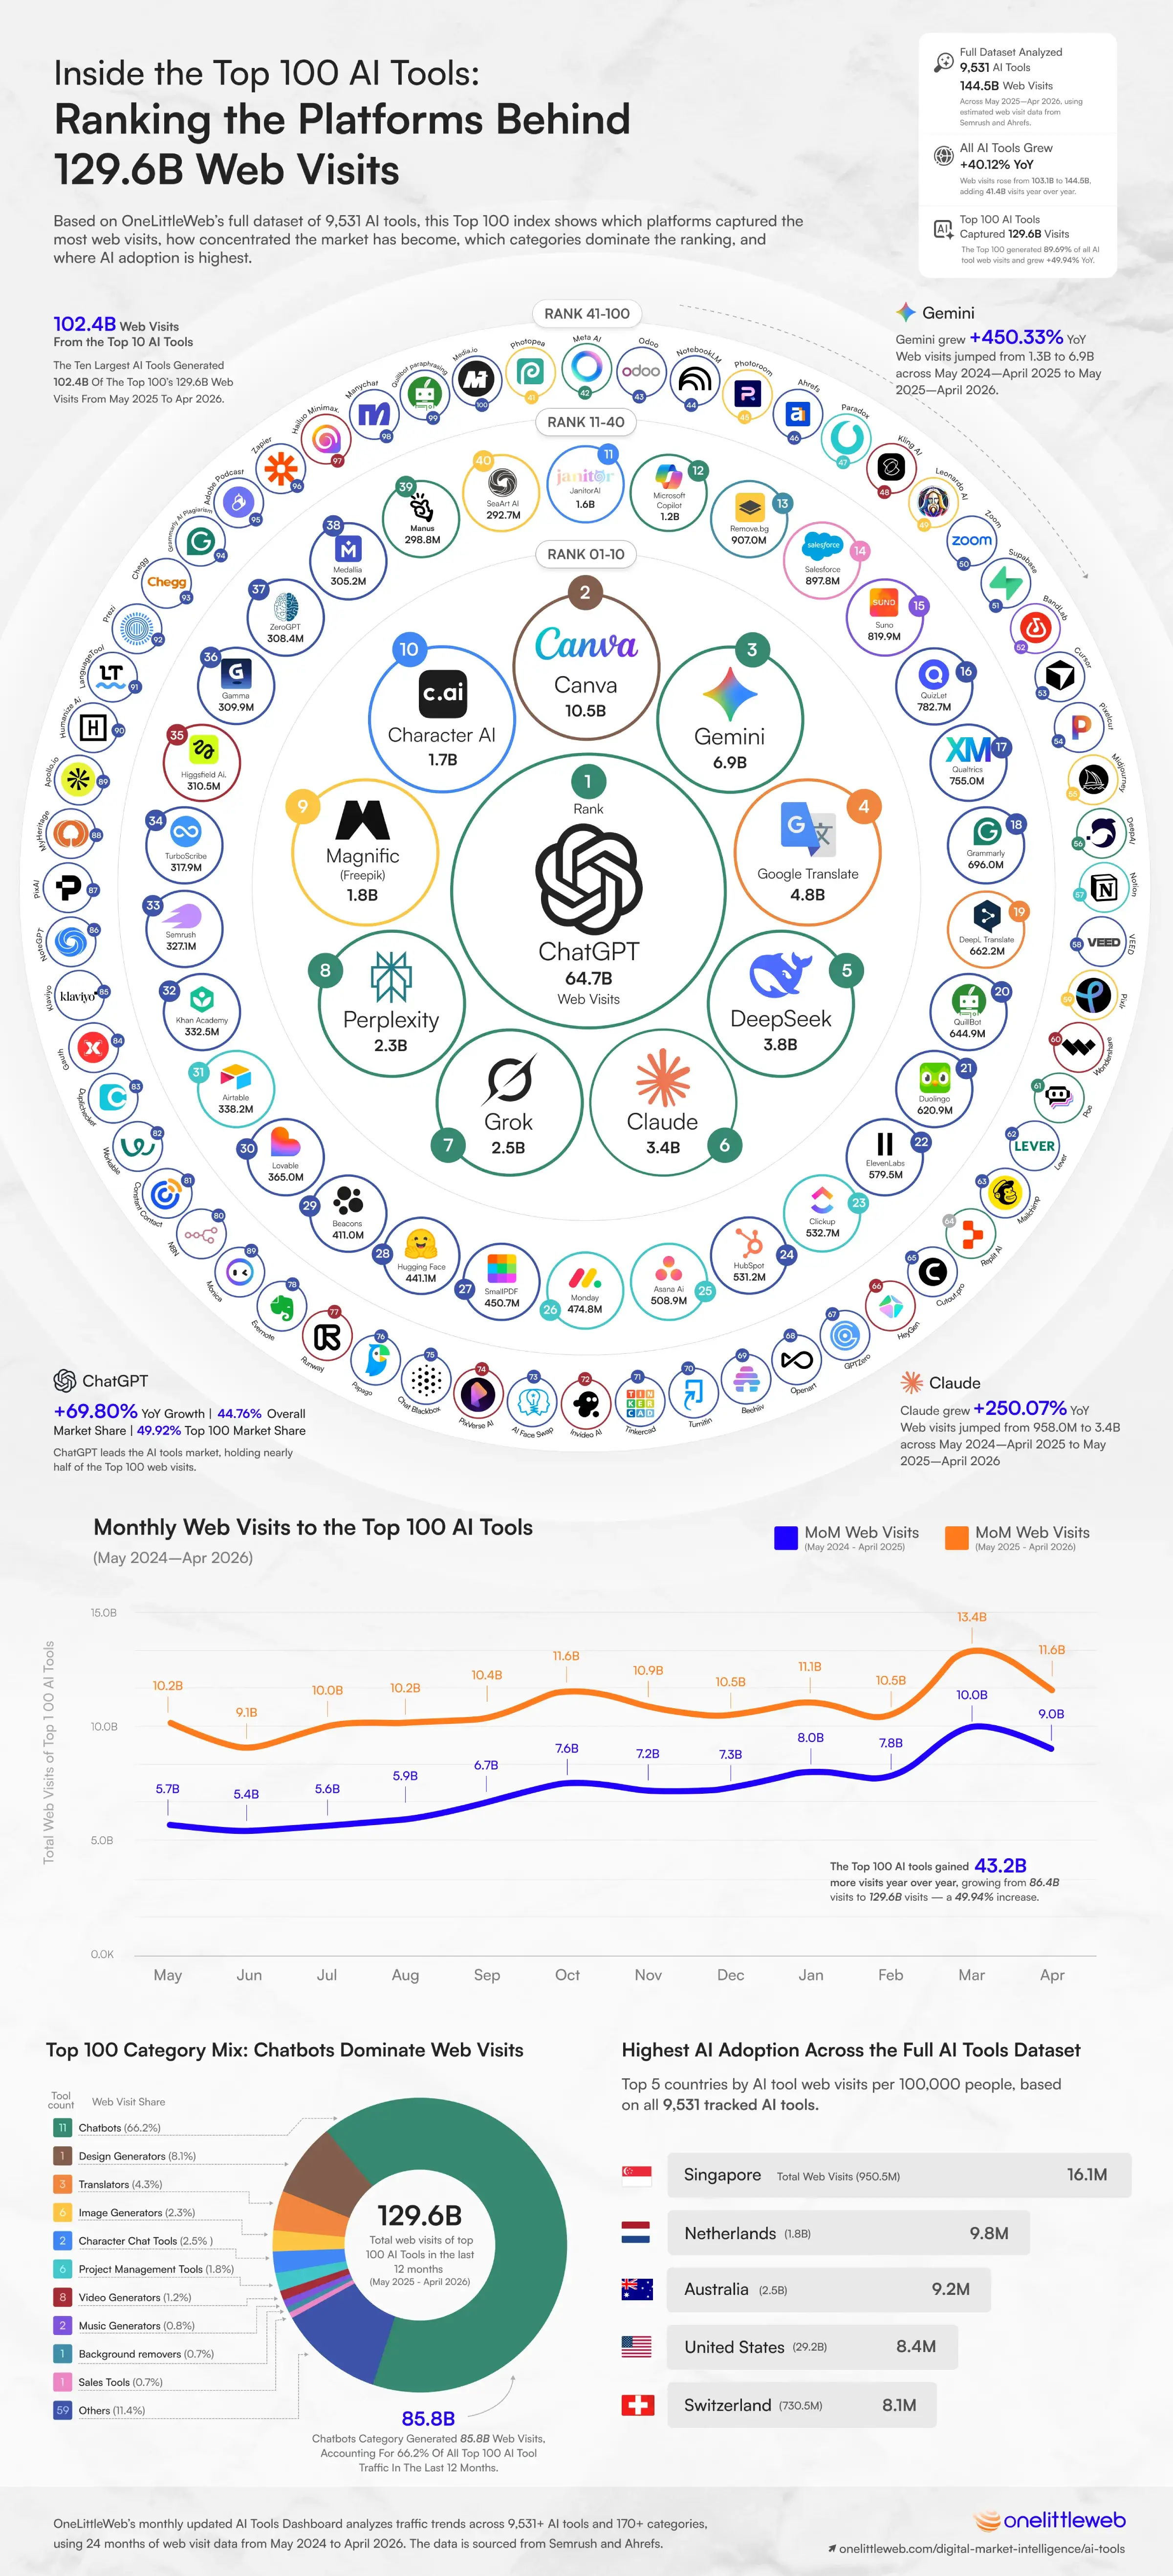
Once you have the visual picture, The full table that follows gives the exact numbers behind the visual, including each tool’s category, web visits across both 12-month periods, year-over-year change, overall AI tool market share, and Top 100 market share.
(may 2024 - apr 2026)
| Rank | Name | URL | Category | Total Web Visits(may 2024 - apr 2025) | Total Web Visits(may 2025 - apr 2026) | Change | Change | Change (%) | Overall AI ToolMarket Share (%) | Top 100Market Share (%) |
|---|---|---|---|---|---|---|---|---|---|---|
| 1 | ChatGPT | https://chatgpt.com/ | Chatbots | 38.1B | 64.7B | 26.6B | +26.6B | +69.80% | 44.76% | 49.92% |
| 2 | Canva | https://www.canva.com/ | Design Generators | 9.1B | 10.5B | 1.4B | +1.4B | +15.54% | 7.26% | 8.10% |
| 3 | Gemini | https://gemini.google.com | Chatbots | 1.3B | 6.9B | 5.6B | +5.6B | +450.33% | 4.77% | 5.31% |
| 4 | Google Translate | https://translate.google.com | Translators | 6.2B | 4.8B | 1.5B | -1.5B | -23.46% | 3.30% | 3.68% |
| 5 | DeepSeek | https://www.deepseek.com/ | Chatbots | 1.7B | 3.8B | 2.2B | +2.2B | +129.10% | 2.65% | 2.96% |
| 6 | Claude | https://claude.ai | Chatbots | 958.0M | 3.4B | 2.4B | +2.4B | +250.07% | 2.32% | 2.59% |
| 7 | Grok | https://grok.com/ | Chatbots | 297.7M | 2.5B | 2.2B | +2.2B | +731.26% | 1.71% | 1.91% |
| 8 | Perplexity | https://www.perplexity.ai/ | Chatbots | 1.2B | 2.3B | 1.2B | +1.2B | +98.38% | 1.62% | 1.81% |
| 9 | Magnific (Freepik) | https://www.magnific.com/ | Image Generators | 2.0B | 1.8B | 151.6M | -151.6M | -7.77% | 1.24% | 1.39% |
| 10 | Character AI | https://character.ai/ | Character Chat Tools | 1.9B | 1.7B | 119.8M | -119.8M | -6.47% | 1.20% | 1.34% |
| 11 | JanitorAI | https://janitorai.com/ | Character Chat Tools | 1.0B | 1.6B | 545.6M | +545.6M | +53.14% | 1.09% | 1.21% |
| 12 | Microsoft Copilot | https://copilot.microsoft.com/ | Chatbots | 795.9M | 1.2B | 412.8M | +412.8M | +51.87% | 0.84% | 0.93% |
| 13 | Remove.bg | https://www.remove.bg/ | Background Removers | 965.4M | 907.0M | 58.4M | -58.4M | -6.05% | 0.63% | 0.70% |
| 14 | Salesforce | https://www.salesforce.com/in/?ir=1 | Sales Tools | 999.5M | 897.8M | 101.6M | -101.6M | -10.17% | 0.62% | 0.69% |
| 15 | Suno | https://suno.com/ | Music Generators | 600.2M | 819.9M | 219.7M | +219.7M | +36.61% | 0.57% | 0.63% |
| 16 | Quizlet | https://quizlet.com/ | Students Tools | 1.1B | 782.7M | 321.1M | -321.1M | -29.09% | 0.54% | 0.60% |
| 17 | Qualtrics | https://www.qualtrics.com/ | B2B Tools | 759.6M | 755.0M | 4.6M | -4.6M | -0.60% | 0.52% | 0.58% |
| 18 | Grammarly | https://www.grammarly.com/ | Grammar Checkers | 823.2M | 696.0M | 127.2M | -127.2M | -15.45% | 0.48% | 0.54% |
| 19 | DeepL Translate | https://www.deepl.com/en/translator | Translators | 758.4M | 662.2M | 96.2M | -96.2M | -12.69% | 0.46% | 0.51% |
| 20 | QuillBot | https://quillbot.com/ | Academic Writing Tools | 862.6M | 644.9M | 217.7M | -217.7M | -25.24% | 0.45% | 0.50% |
| 21 | Duolingo | https://www.duolingo.com/ | Language Learning Tools | 780.7M | 620.9M | 159.8M | -159.8M | -20.47% | 0.43% | 0.48% |
| 22 | ElevenLabs | https://elevenlabs.io/ | Text To Speech Tools | 349.9M | 579.5M | 229.6M | +229.6M | +65.61% | 0.40% | 0.45% |
| 23 | Clickup | https://clickup.com/ | Project Management Tools | 388.9M | 532.7M | 143.8M | +143.8M | +36.96% | 0.37% | 0.41% |
| 24 | HubSpot | https://www.hubspot.com | Marketing Tools | 512.0M | 531.2M | 19.2M | +19.2M | +3.75% | 0.37% | 0.41% |
| 25 | Asana Ai | https://asana.com/ | Project Management Tools | 512.4M | 508.9M | 3.5M | -3.5M | -0.68% | 0.35% | 0.39% |
| 26 | Monday | https://monday.com/ | Project Management Tools | 422.9M | 474.8M | 51.9M | +51.9M | +12.27% | 0.33% | 0.37% |
| 27 | SmallPDF.com | https://smallpdf.com/ | PDF Tools | 497.2M | 450.7M | 46.5M | -46.5M | -9.35% | 0.31% | 0.35% |
| 28 | Hugging Face | https://huggingface.co/ | Large Language Models | 387.6M | 441.1M | 53.5M | +53.5M | +13.80% | 0.31% | 0.34% |
| 29 | Beacons | https://beacons.ai/ | Content Marketing Tools | 373.1M | 411.0M | 37.9M | +37.9M | +10.17% | 0.28% | 0.32% |
| 30 | Lovable | https://lovable.dev/ | Website Builders | 38.4M | 365.0M | 326.7M | +326.7M | +851.55% | 0.25% | 0.28% |
| 31 | Airtable | https://airtable.com/ | Project Management Tools | 300.0M | 338.2M | 38.2M | +38.2M | +12.72% | 0.23% | 0.26% |
| 32 | Khan Academy | https://www.khanacademy.org/ | Teachers Tools | 420.8M | 332.5M | 88.3M | -88.3M | -20.99% | 0.23% | 0.26% |
| 33 | Semrush | https://www.semrush.com/ | SEO Tools | 334.8M | 327.1M | 7.8M | -7.8M | -2.32% | 0.23% | 0.25% |
| 34 | TurboScribe | https://turboscribe.ai/ | Transcription Tools | 78.3M | 317.9M | 239.6M | +239.6M | +306.00% | 0.22% | 0.25% |
| 35 | Higgsfield AI. | https://higgsfield.ai/ | Video Generators | 34.9M | 310.5M | 275.7M | +275.7M | +790.59% | 0.21% | 0.24% |
| 36 | Gamma | https://gamma.app/ | Presentation Makers | 184.3M | 309.9M | 125.6M | +125.6M | +68.15% | 0.21% | 0.24% |
| 37 | ZeroGPT | https://www.zerogpt.com/ | AI Detectors | 198.1M | 308.4M | 110.3M | +110.3M | +55.68% | 0.21% | 0.24% |
| 38 | Medallia | https://www.medallia.com/ | Customer Service Tools | 389.9M | 305.2M | 84.7M | -84.7M | -21.72% | 0.21% | 0.24% |
| 39 | Manus | https://manus.im/ | Chatbots | 63.5M | 298.8M | 235.3M | +235.3M | +370.45% | 0.21% | 0.23% |
| 40 | Seaart.ai | https://seaart.ai/ | Image Generators | 163.7M | 292.7M | 129.0M | +129.0M | +78.81% | 0.20% | 0.23% |
| 41 | Photopea | https://www.photopea.com/ | Photo Editors | 246.0M | 286.0M | 40.0M | +40.0M | +16.25% | 0.20% | 0.22% |
| 42 | Meta AI | https://www.meta.ai/ | Chatbots | 98.8M | 284.9M | 186.1M | +186.1M | +188.39% | 0.20% | 0.22% |
| 43 | Odoo | https://www.odoo.com/ | Project Management Tools | 201.4M | 284.6M | 83.2M | +83.2M | +41.33% | 0.20% | 0.22% |
| 44 | NotebookLM | https://notebooklm.google/ | Academic Research Tools | 63.9M | 279.0M | 215.2M | +215.2M | +336.94% | 0.19% | 0.22% |
| 45 | Photoroom | https://www.photoroom.com/ | Image Generators | 193.1M | 273.6M | 80.5M | +80.5M | +41.69% | 0.19% | 0.21% |
| 46 | Ahrefs | https://ahrefs.com/ | SEO Tools | 303.7M | 266.0M | 37.7M | -37.7M | -12.41% | 0.18% | 0.21% |
| 47 | Paradox | https://www.paradox.ai/ | Recruitment Tools | 166.9M | 256.0M | 89.1M | +89.1M | +53.37% | 0.18% | 0.20% |
| 48 | Kling AI | https://klingai.com/global/?ref=aitools&utm_source=aitools&utm_medium=referral | Video Generators | 143.4M | 248.5M | 105.1M | +105.1M | +73.33% | 0.17% | 0.19% |
| 49 | Leonardo AI | https://leonardo.ai/ | Image Generators | 262.3M | 239.2M | 23.1M | -23.1M | -8.80% | 0.17% | 0.18% |
| 50 | Zoom | https://www.zoom.com | AI Note Takers | 156.4M | 236.8M | 80.4M | +80.4M | +51.42% | 0.16% | 0.18% |
| 51 | Supabase | https://supabase.com/ | App Builders | 45.6M | 232.6M | 187.0M | +187.0M | +410.01% | 0.16% | 0.18% |
| 52 | BandLab | https://www.bandlab.com/ | Music Generators | 180.0M | 229.9M | 49.9M | +49.9M | +27.71% | 0.16% | 0.18% |
| 53 | Cursor | https://www.cursor.com/ | Code Generators | 66.2M | 222.2M | 156.0M | +156.0M | +235.85% | 0.15% | 0.17% |
| 54 | Pixelcut | https://www.pixelcut.ai/ | Image Enhancer & Upscalers | 138.1M | 214.5M | 76.4M | +76.4M | +55.33% | 0.15% | 0.17% |
| 55 | Midjourney | https://www.midjourney.com/ | Image Generators | 188.3M | 211.9M | 23.6M | +23.6M | +12.51% | 0.15% | 0.16% |
| 56 | DeepAI | https://deepai.org/ | Chatbots | 278.8M | 211.5M | 67.3M | -67.3M | -24.13% | 0.15% | 0.16% |
| 57 | Notion | https://www.notion.com/ | Project Management Tools | 82.0M | 207.7M | 125.7M | +125.7M | +153.28% | 0.14% | 0.16% |
| 58 | VEED | https://www.veed.io/ | Video Editing Tools | 216.5M | 207.3M | 9.2M | -9.2M | -4.25% | 0.14% | 0.16% |
| 59 | Pixlr | https://pixlr.com/ | Image Generators | 227.7M | 203.4M | 24.3M | -24.3M | -10.67% | 0.14% | 0.16% |
| 60 | Wondershare | https://www.wondershare.com/ | Video Generators | 261.1M | 190.2M | 70.9M | -70.9M | -27.14% | 0.13% | 0.15% |
| 61 | Poe | https://poe.com/ | Chatbots | 126.2M | 186.7M | 60.5M | +60.5M | +47.98% | 0.13% | 0.14% |
| 62 | Lever | https://www.lever.co/ | Recruitment Tools | 210.1M | 186.6M | 23.5M | -23.5M | -11.17% | 0.13% | 0.14% |
| 63 | Mailchimp | https://mailchimp.com/ | Email Marketing Tools | 213.3M | 186.1M | 27.2M | -27.2M | -12.76% | 0.13% | 0.14% |
| 64 | Replit AI | https://replit.com/ | Website Builders | 117.6M | 183.6M | 66.0M | +66.0M | +56.11% | 0.13% | 0.14% |
| 65 | Cutout.pro | https://www.cutout.pro/ | Photo Editors | 189.0M | 170.4M | 18.6M | -18.6M | -9.85% | 0.12% | 0.13% |
| 66 | HeyGen | https://www.heygen.com/ | Video Generators | 57.5M | 169.0M | 111.5M | +111.5M | +193.99% | 0.12% | 0.13% |
| 67 | GPTZero | https://gptzero.me/ | AI Detectors | 114.5M | 160.6M | 46.1M | +46.1M | +40.26% | 0.11% | 0.12% |
| 68 | Openart | https://openart.ai/ | Art Generators | 90.9M | 157.7M | 66.8M | +66.8M | +73.46% | 0.11% | 0.12% |
| 69 | Beehiiv | https://www.beehiiv.com/ | Email Marketing Tools | 119.0M | 157.2M | 38.2M | +38.2M | +32.14% | 0.11% | 0.12% |
| 70 | Turnitin | https://www.turnitin.com/ | AI Detectors | 158.8M | 155.1M | 3.7M | -3.7M | -2.32% | 0.11% | 0.12% |
| 71 | Tinkercad | https://www.tinkercad.com/ | 3D Model Generators | 137.7M | 152.8M | 15.1M | +15.1M | +10.95% | 0.11% | 0.12% |
| 72 | Invideo AI | https://invideo.io/ | Video Generators | 181.5M | 147.4M | 34.1M | -34.1M | -18.80% | 0.10% | 0.11% |
| 73 | AI Face Swap | https://aifaceswap.io/ | Deepfake Makers | 65.3M | 147.1M | 81.8M | +81.8M | +125.26% | 0.10% | 0.11% |
| 74 | PixVerse AI | https://pixverse.ai/ | Video Generators | 95.6M | 146.6M | 51.0M | +51.0M | +53.39% | 0.10% | 0.11% |
| 75 | Chat Blackbox | https://www.blackbox.ai | Programming Tools | 166.3M | 138.0M | 28.3M | -28.3M | -17.00% | 0.10% | 0.11% |
| 76 | Papago | https://papago.naver.com/ | Translators | 188.9M | 134.5M | 54.4M | -54.4M | -28.79% | 0.09% | 0.10% |
| 77 | Runway | https://runwayml.com/ | Video Generators | 113.8M | 133.9M | 20.1M | +20.1M | +17.69% | 0.09% | 0.10% |
| 78 | Evernote | https://evernote.com/ | AI Note Takers | 147.2M | 132.0M | 15.2M | -15.2M | -10.32% | 0.09% | 0.10% |
| 79 | Monica | https://monica.im/ | AI Assistants | 137.4M | 132.0M | 5.4M | -5.4M | -3.94% | 0.09% | 0.10% |
| 80 | N8N | https://n8n.io/ | Automation Tools | 23.9M | 130.7M | 106.8M | +106.8M | +446.20% | 0.09% | 0.10% |
| 81 | Constant Contact | https://www.constantcontact.com/ | Email Marketing Tools | 142.1M | 130.0M | 12.1M | -12.1M | -8.48% | 0.09% | 0.10% |
| 82 | Workable | https://www.workable.com/ | Recruitment Tools | 128.8M | 129.6M | 751.0K | +751.0K | +0.58% | 0.09% | 0.10% |
| 83 | Duplichecker | https://www.duplichecker.com/ | Plagiarism Checkers | 168.4M | 129.1M | 39.3M | -39.3M | -23.32% | 0.09% | 0.10% |
| 84 | Gauth | https://www.gauthmath.com/ | Academic Research Tools | 134.0M | 128.0M | 6.0M | -6.0M | -4.46% | 0.09% | 0.10% |
| 85 | Klaviyo | https://www.klaviyo.com/ | Customer Service Tools | 75.6M | 125.0M | 49.4M | +49.4M | +65.36% | 0.09% | 0.10% |
| 86 | NoteGPT | https://notegpt.io/ | Summarizers | 37.7M | 124.1M | 86.4M | +86.4M | +229.07% | 0.09% | 0.10% |
| 87 | PixAI | https://pixai.art/ | Art Generators | 69.1M | 122.9M | 53.8M | +53.8M | +77.87% | 0.09% | 0.09% |
| 88 | MyHeritage | https://www.myheritage.com/ | Avatar Makers | 109.4M | 122.4M | 13.0M | +13.0M | +11.93% | 0.08% | 0.09% |
| 89 | Apollo.io | https://www.apollo.io/ | Lead Generation Tools | 103.3M | 118.3M | 15.0M | +15.0M | +14.55% | 0.08% | 0.09% |
| 90 | Humanize AI | https://www.humanizeai.pro/ | AI Humanizers | 94.9M | 117.6M | 22.7M | +22.7M | +23.91% | 0.08% | 0.09% |
| 91 | LanguageTool | https://languagetool.org/ | Grammar Checkers | 130.1M | 113.0M | 17.1M | -17.1M | -13.18% | 0.08% | 0.09% |
| 92 | Prezi | https://prezi.com/ | Presentation Makers | 141.4M | 110.7M | 30.7M | -30.7M | -21.70% | 0.08% | 0.09% |
| 93 | Chegg | https://www.chegg.com/ | Assignment Tools | 281.2M | 108.4M | 172.8M | -172.8M | -61.45% | 0.07% | 0.08% |
| 94 | Grammarly AI Plagiarism Checker | https://www.grammarly.com/plagiarism-checker | Plagiarism Checkers | 175.1M | 108.4M | 66.7M | -66.7M | -38.10% | 0.07% | 0.08% |
| 95 | Adobe Podcast | https://podcast.adobe.com/ | Podcast Tools | 71.4M | 107.5M | 36.1M | +36.1M | +50.51% | 0.07% | 0.08% |
| 96 | Zapier | https://zapier.com/ | Automation Tools | 130.1M | 107.1M | 23.0M | -23.0M | -17.71% | 0.07% | 0.08% |
| 97 | Hailuo Minimax. | https://hailuoai.video/ | Video Generators | 135.2M | 107.0M | 28.1M | -28.1M | -20.81% | 0.07% | 0.08% |
| 98 | Manychat | https://manychat.com/ | Marketing Tools | 113.3M | 106.4M | 6.9M | -6.9M | -6.08% | 0.07% | 0.08% |
| 99 | QuillBot Paraphrasing Tool | https://quillbot.com/paraphrasing-tool | Paraphrasing Tools | 196.6M | 105.8M | 90.8M | -90.8M | -46.20% | 0.07% | 0.08% |
| 100 | Media.io | https://www.media.io | Video Editing Tools | 122.1M | 105.4M | 16.7M | -16.7M | -13.66% | 0.07% | 0.08% |
The Top 100 ranking gives us the full picture, but most web visits are still concentrated near the top. The first 20 AI tools alone account for roughly 77% of all AI tool web visits we tracked, so this is where the clearest shifts in user behavior begin to appear.
As we move through the ranking, you’ll notice that these AI tools are not all growing for the same reason. ChatGPT is still expanding at a scale no other AI tool can match, while Gemini, Claude, Grok, DeepSeek, and Perplexity are gaining ground as competition among chatbots becomes stronger.
At the same time, several established AI tools are moving in the opposite direction. Google Translate, Quizlet, Grammarly, DeepL, and QuillBot all lost web visits, suggesting that some users may be moving away from single-purpose tools and toward AI tools that can handle several tasks in one place.
The visual below ranks the top 20 AI tools by their total web visits from May 2025 to April 2026. It gives us a clear visual comparison of their scale, showing just how far the market leaders sit ahead of the rest. From there, we will examine each AI tool individually, using its 24-month web visit trend, year-over-year change, category position, and market share to explain what is driving its growth, stability, or decline.
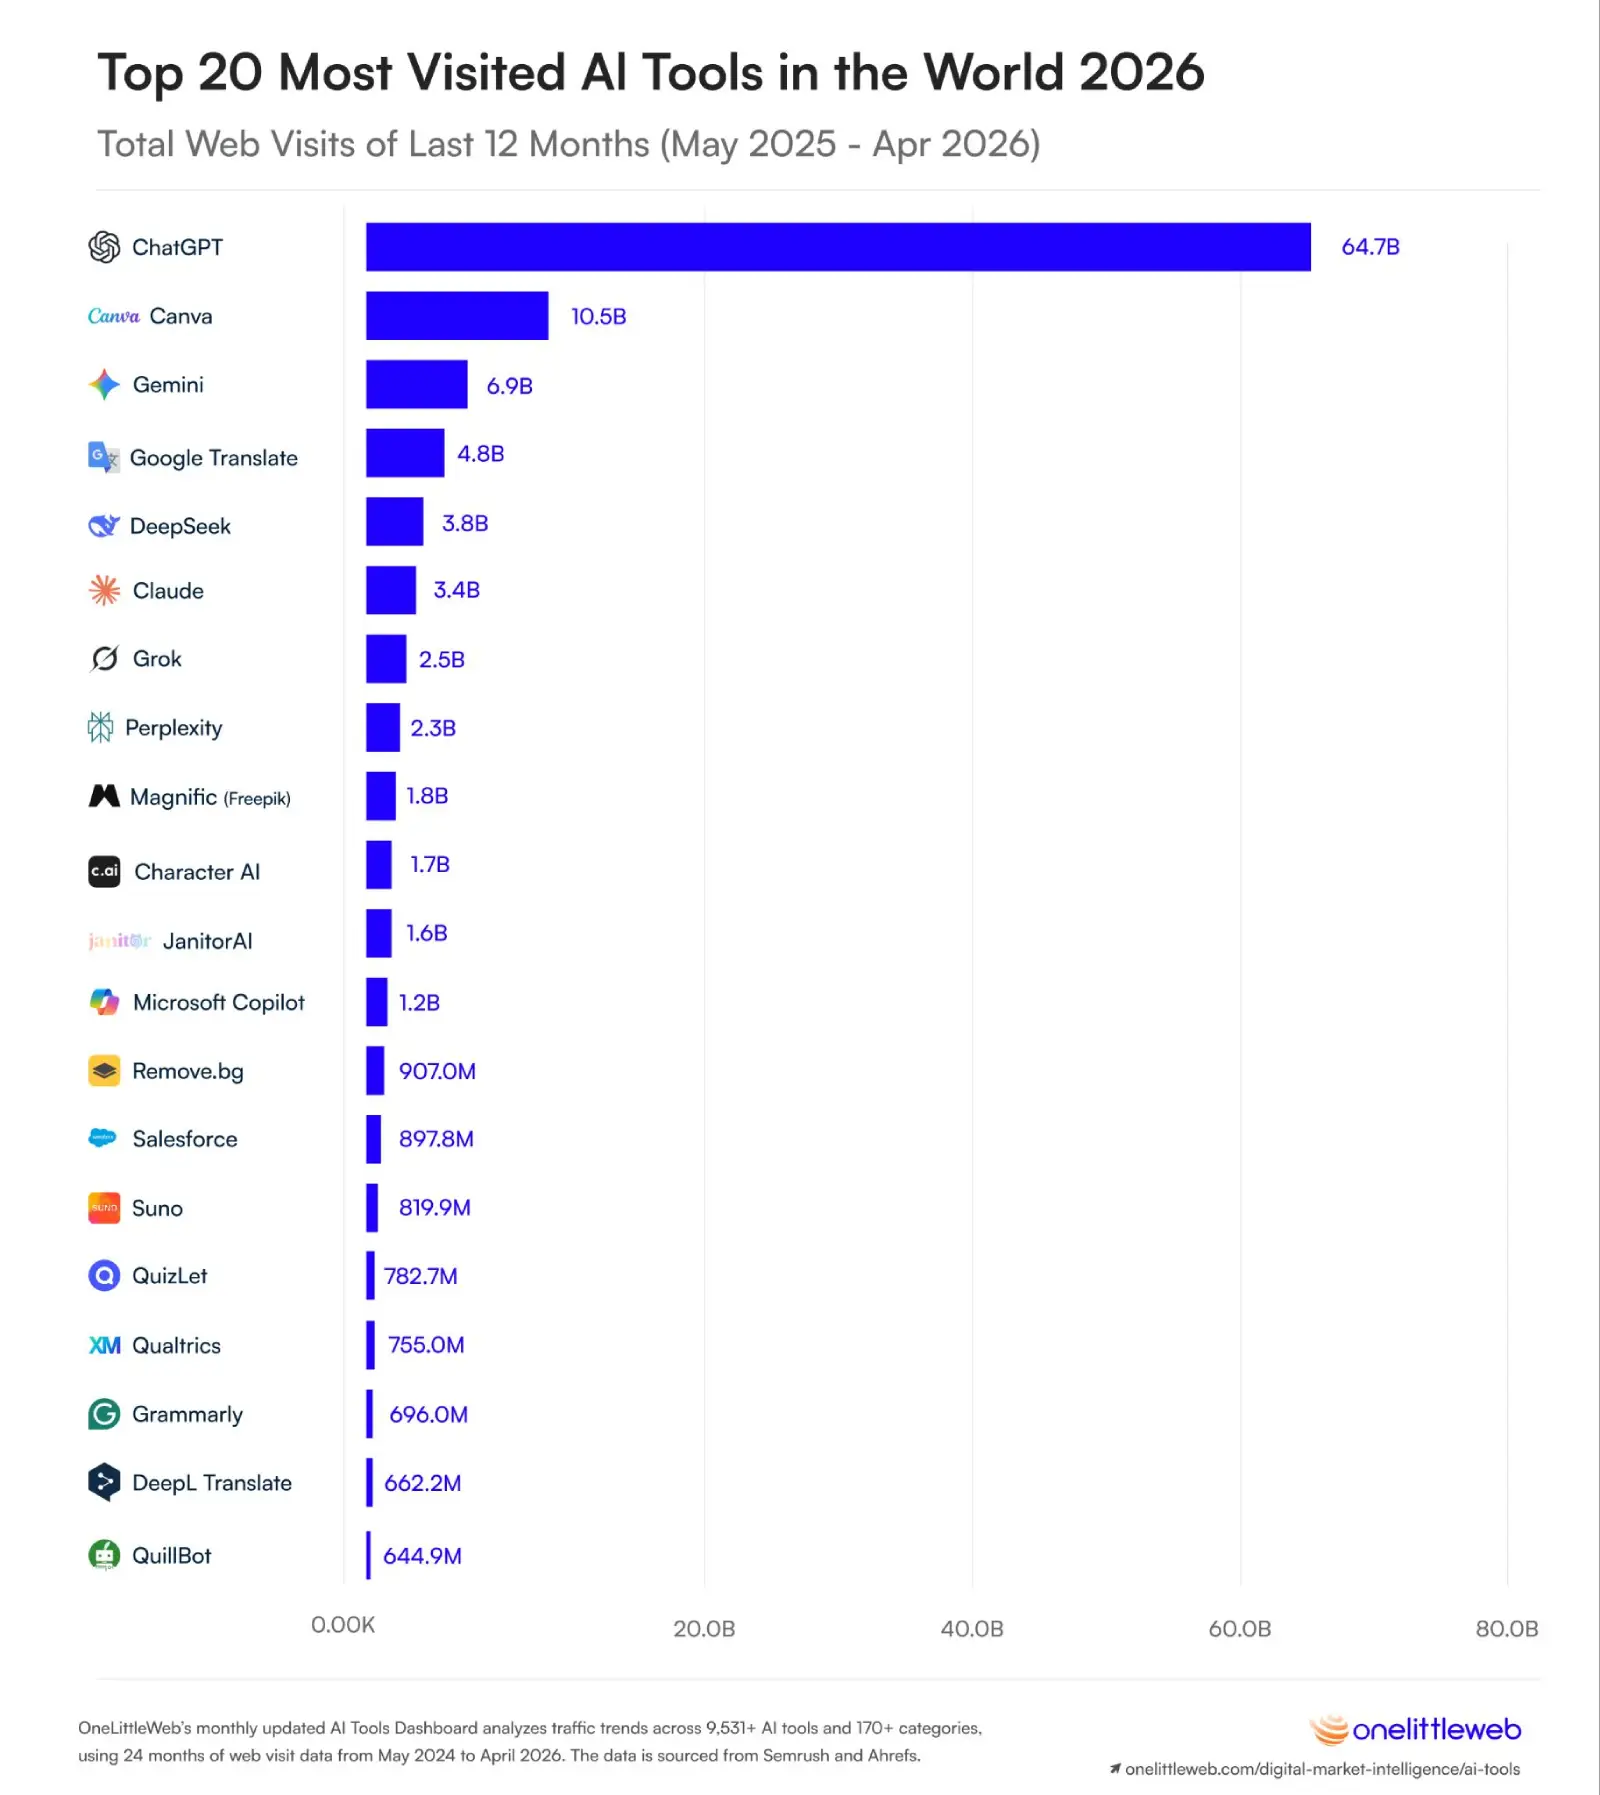
The visual shows where each AI tool finished over the latest 12 months, but the annual totals only tell part of the story. They do not show whether an AI tool grew steadily, surged after one breakout month, reached a peak and declined, or remained stable throughout the period.
That is why we wanted to look beyond the final ranking.
In the individual deep dives that follow, we examine each of the Top 20 AI tools using its 24-month web visit trend, year-over-year growth, overall market share, and category position. This allows us to explain not only how large each AI tool has become but also what happened behind the numbers and what its recent direction may mean for the market.
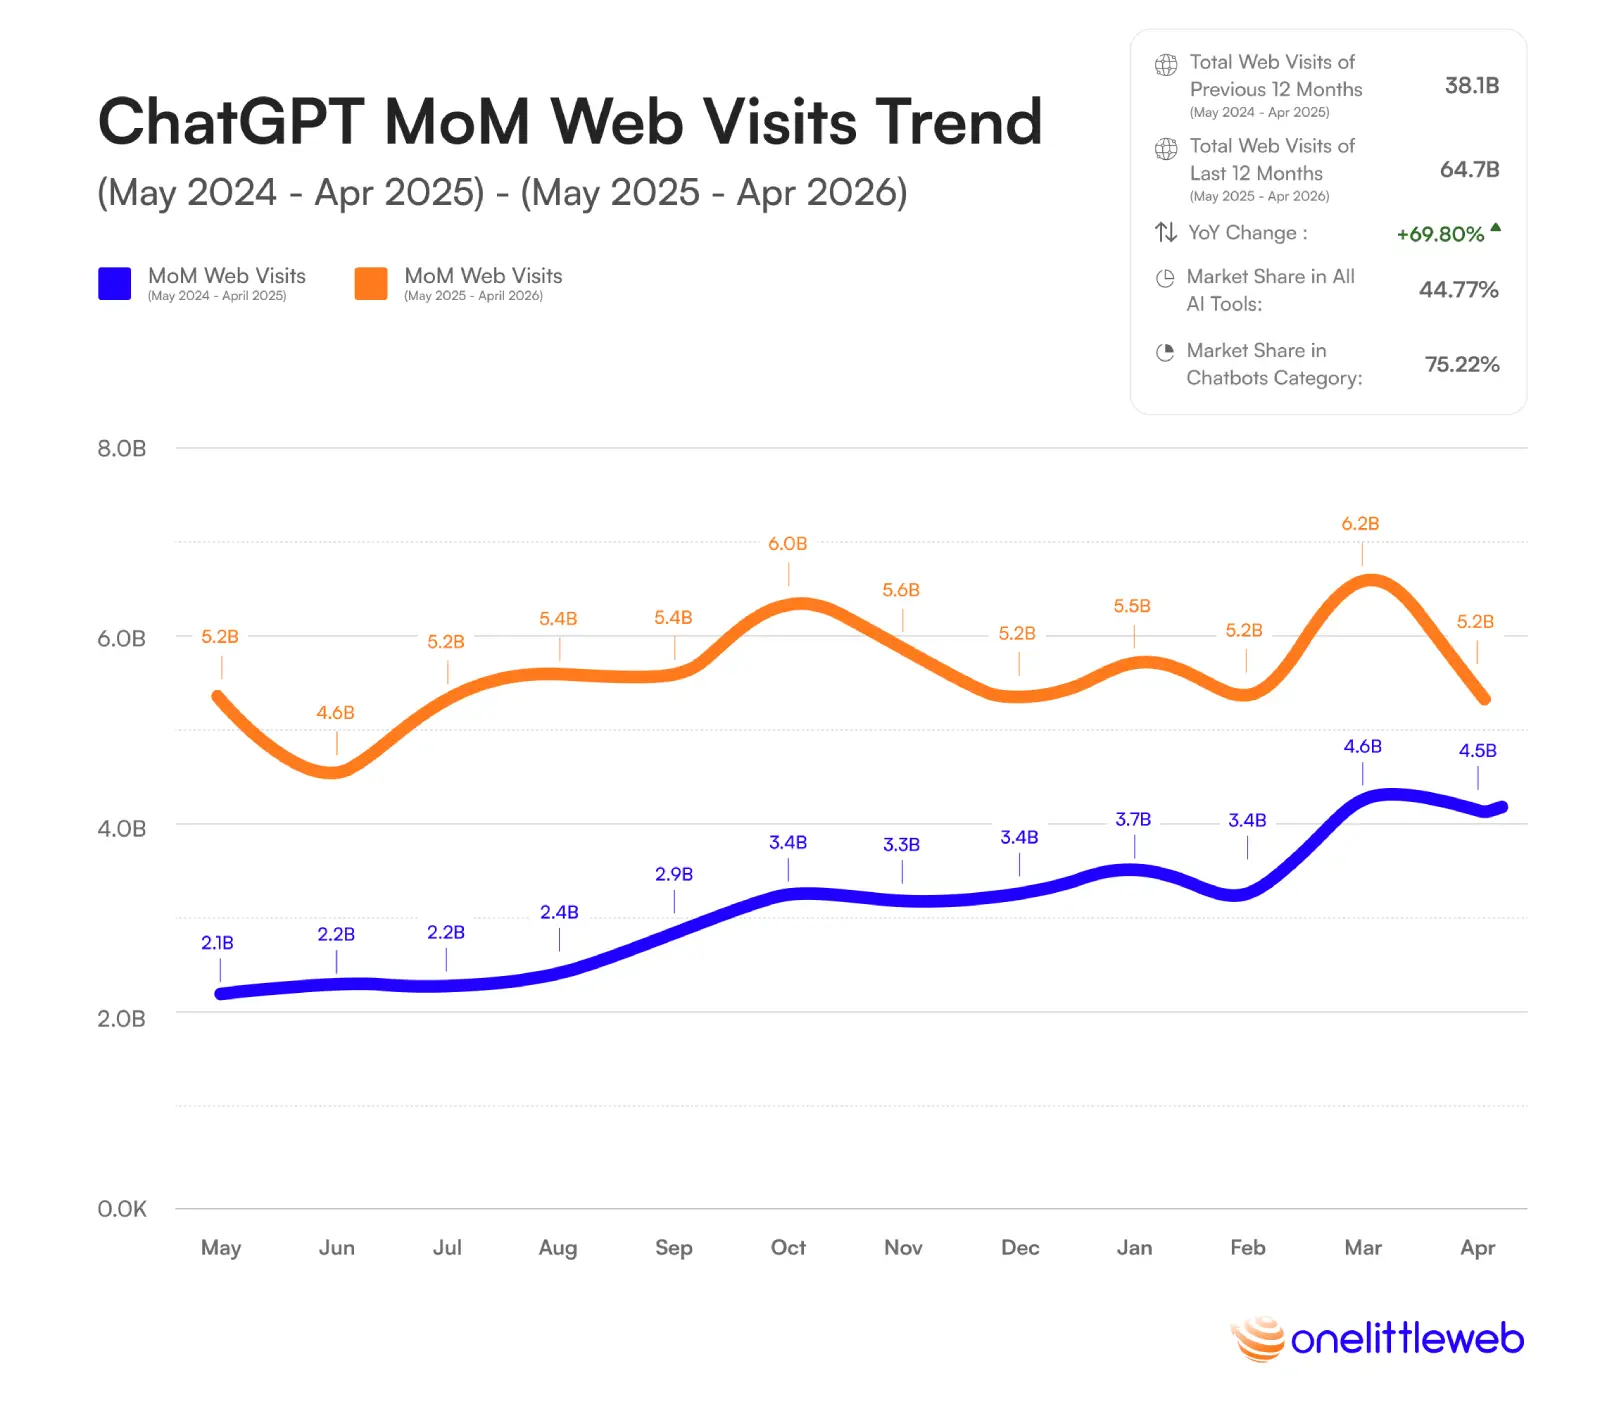
As we begin our deep dive, no AI tool shows the concentration of the market more clearly than ChatGPT. It generated 64.7 billion web visits over the latest 12 months, up from 38.1 billion the year before, and accounted for 44.76% of all AI tool web visits we tracked.
ChatGPT alone generated almost as many web visits as the other 99 AI tools in the Top 100 combined, 64.7 billion compared with 64.9 billion.
The 24-month trend shows that ChatGPT’s growth was substantial but not perfectly smooth. Monthly web visits rose from 2.1 billion in May 2024 to 5.2 billion in April 2026, while its latest 12 months generally stayed between 4.6 billion and 6.2 billion. It reached its highest point in March 2026 with 6.19 billion visits, before falling back to 5.20 billion in April. Rather than showing a steady month-by-month climb, the data suggests ChatGPT has moved into a much higher range where monthly swings can still involve hundreds of millions of visits.
That scale comes partly from how widely people now use ChatGPT. It is no longer limited to answering questions or writing text; users rely on it for coding, research, learning, planning, and everyday work. Its 69.80% year-over-year growth shows that adoption is still expanding, even as Gemini, DeepSeek, Claude, and other chatbot competitors continue to gain web visits.
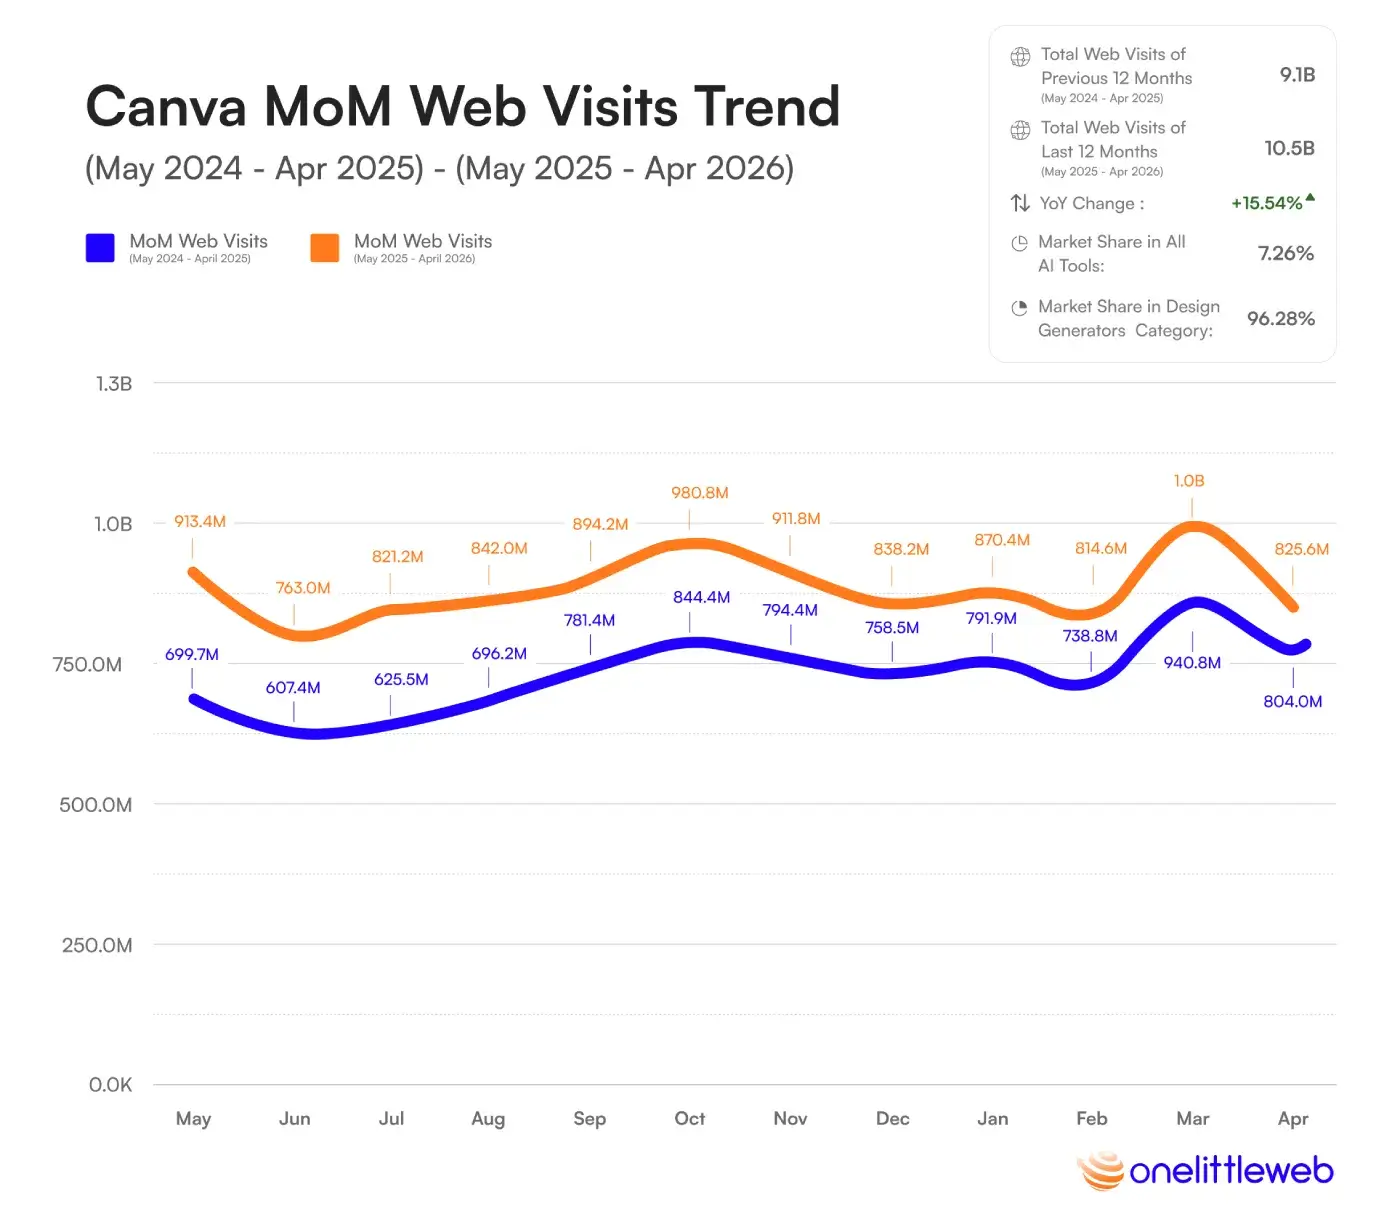
After ChatGPT, the ranking takes an interesting turn. The second-most-visited AI tool in our study was not another chatbot, but Canva. It generated 10.5 billion web visits over the latest 12 months, up from 9.1 billion, adding another 1.4 billion visits while already operating at an enormous scale.
Canva captured 96.28% of all web visits in the Design Generators category and generated more visits than DeepSeek, Claude, and Grok combined.
Its 24-month trend was not a straight climb, but the underlying level clearly moved higher. Canva averaged roughly 757 million monthly web visits during the first 12 months, compared with about 875 million per month in the latest period. It reached a new monthly peak of 1.02 billion visits in March 2026 before falling back to 825.6 million in April.
What stands out to us is how Canva has brought AI into a tool people were already using for presentations, social graphics, images, and everyday design work. Users do not necessarily need to seek out a separate AI tool; they can access those features inside an existing workflow. That helps explain why Canva remains far ahead of every other AI design generator, even with a more moderate 15.54% year-over-year growth rate.
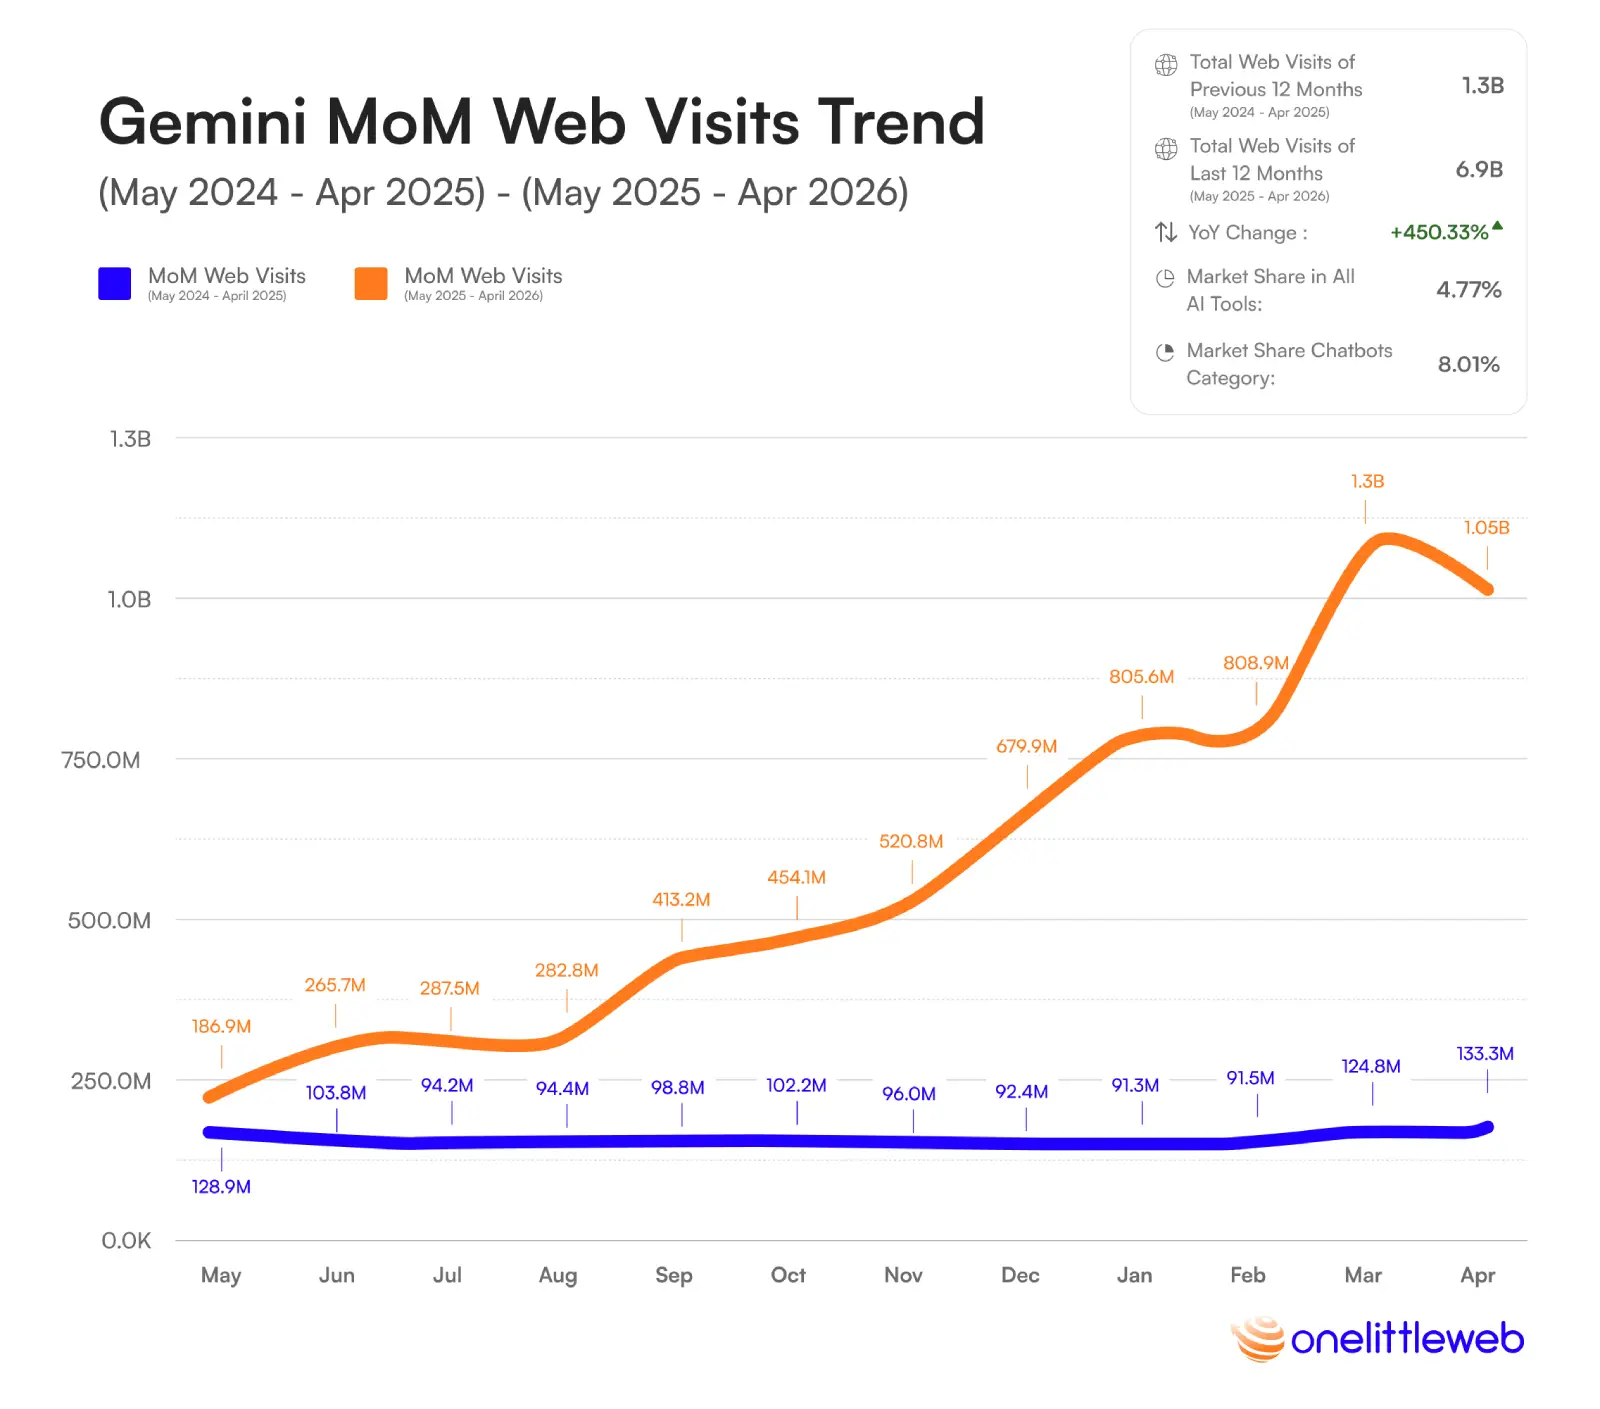
After Canva, the ranking returns to chatbots, and this is where we see the clearest challenge to ChatGPT’s lead. Gemini generated 6.9 billion web visits over the latest 12 months, up from 1.3 billion the year before. That added 5.6 billion visits, the second-largest absolute increase of any AI tool in our study.
Gemini reached 1.05 billion web visits in April 2026, nearly eight times the 133.3 million visits it recorded in April 2025.
What caught our attention was not just the annual growth rate but how sharply the monthly trend accelerated. Gemini began the latest period with 186.9 million visits in May 2025, crossed 400 million in September, reached 679.9 million in December, and passed 800 million in January 2026. It then climbed to a record 1.13 billion visits in March before easing slightly to 1.05 billion in April.
This was not growth built around one temporary spike. Gemini’s average monthly web visits increased from roughly 104 million in the previous 12 months to about 574 million in the latest period. Its 450.33% year-over-year growth suggests Google is turning Gemini into a much more visible part of its wider product ecosystem, and users are responding at scale.
Even so, the gap remains large. ChatGPT generated around 9.4 times more web visits than Gemini over the same 12 months. Gemini is now the closest chatbot challenger by total web visits, but it still has a long distance to cover.
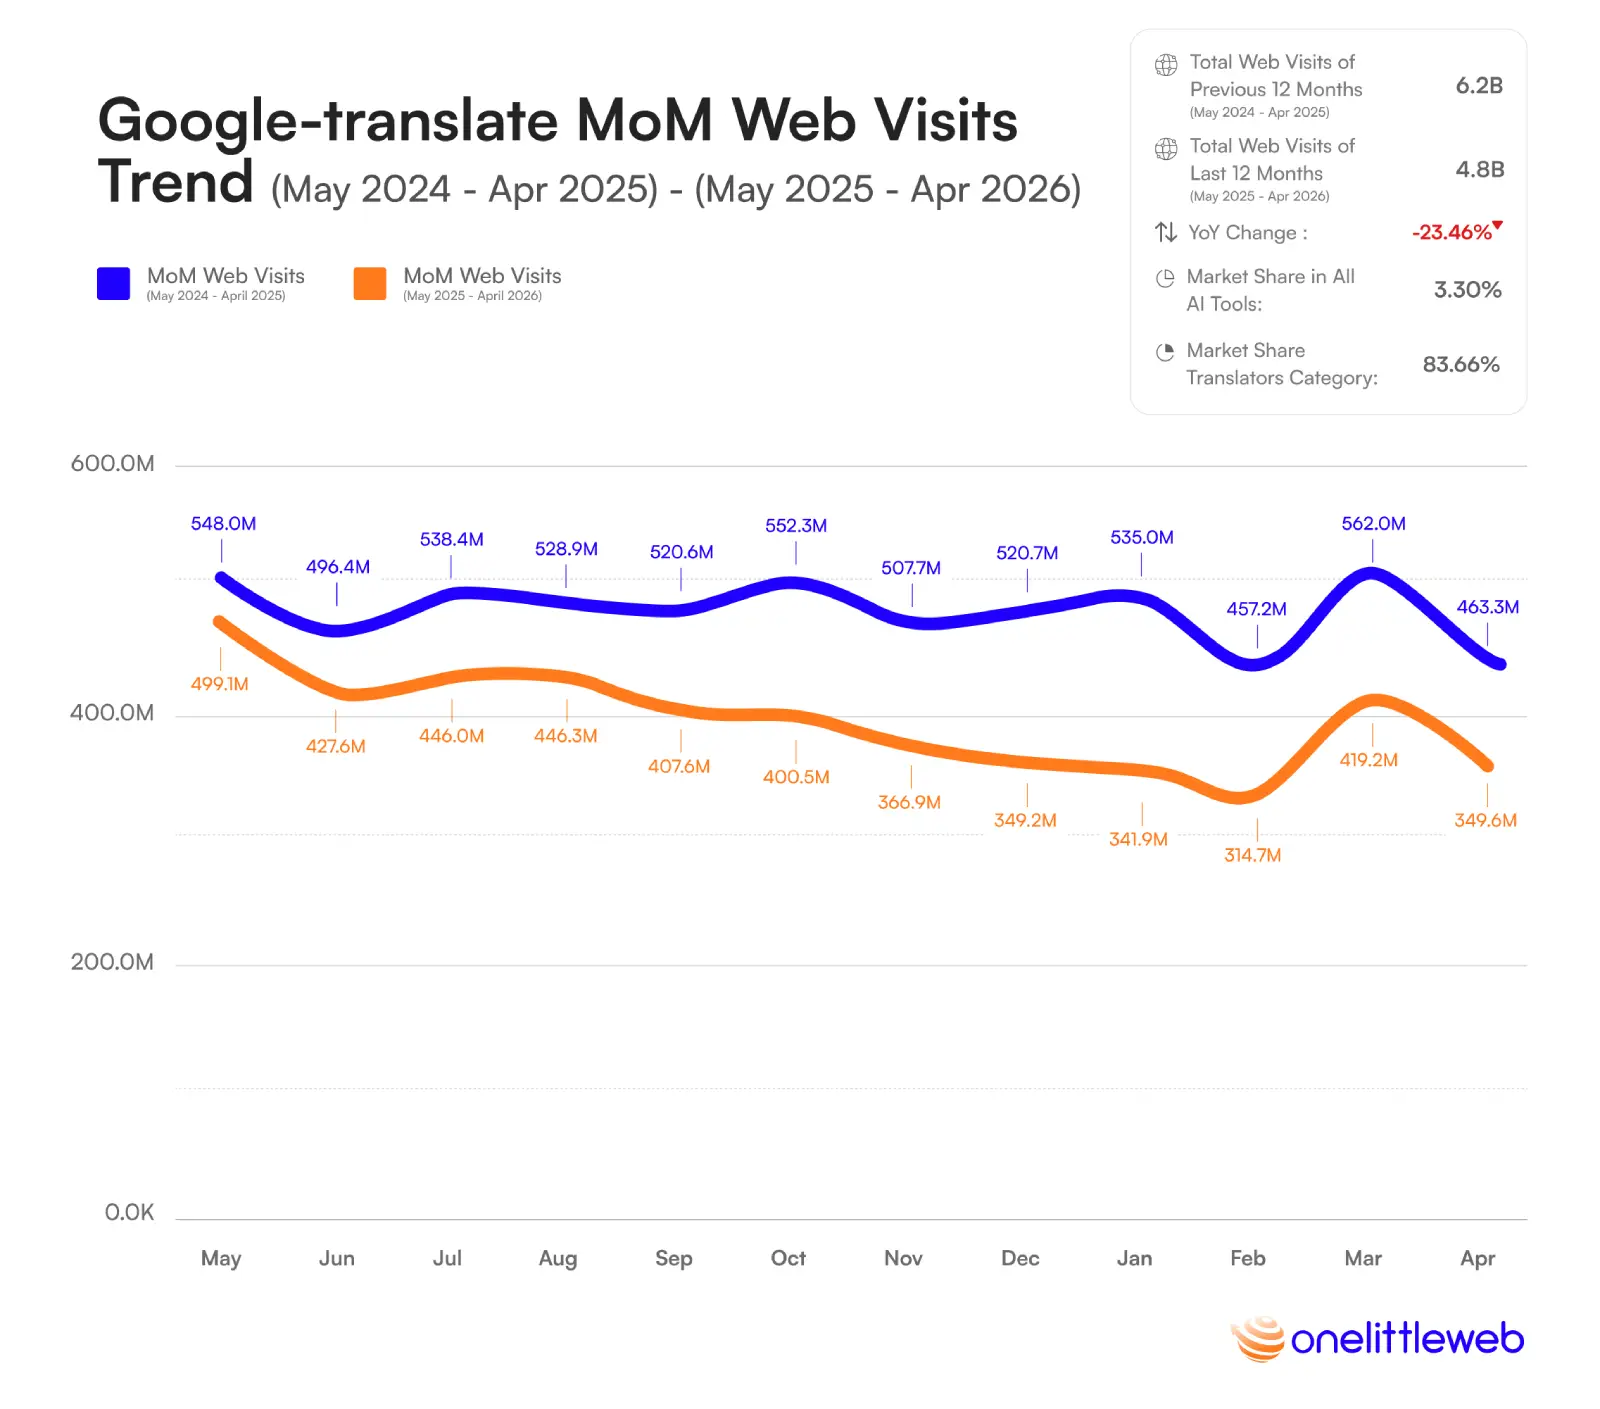
After three growing AI tools, Google Translate is where the ranking changes direction. It remained the world’s most-visited translation tool, generating 4.8 billion web visits over the latest 12 months. Yet that was 1.5 billion fewer visits than the previous year, the largest absolute decline recorded by any AI tool in the top 100.
Google Translate lost 1.46 billion web visits year over year, more than Microsoft Copilot generated during the entire latest 12-month period, yet it still controlled 83.66% of all web visits in the Translators category.
This was not a decline caused by one unusually weak month. Google Translate generally attracted between 457 million and 562 million monthly visits during the first year of our analysis. In the latest 12 months, it began at 499.1 million visits in May 2025, fell below 400 million in November, and reached a 24-month low of 314.7 million in February 2026. There was a brief recovery to 419.2 million in March, but visits dropped again to 349.6 million in April.
What makes this decline more interesting is that Google Translate still controls 83.66% of all web visits in the Translators category. It is not losing its category leadership to another standalone translator; the entire category is under pressure. One likely explanation is that translation is increasingly being handled inside broader AI tools such as ChatGPT, Gemini, and Claude, where users can translate, rewrite, explain, and continue working without opening a separate tool.
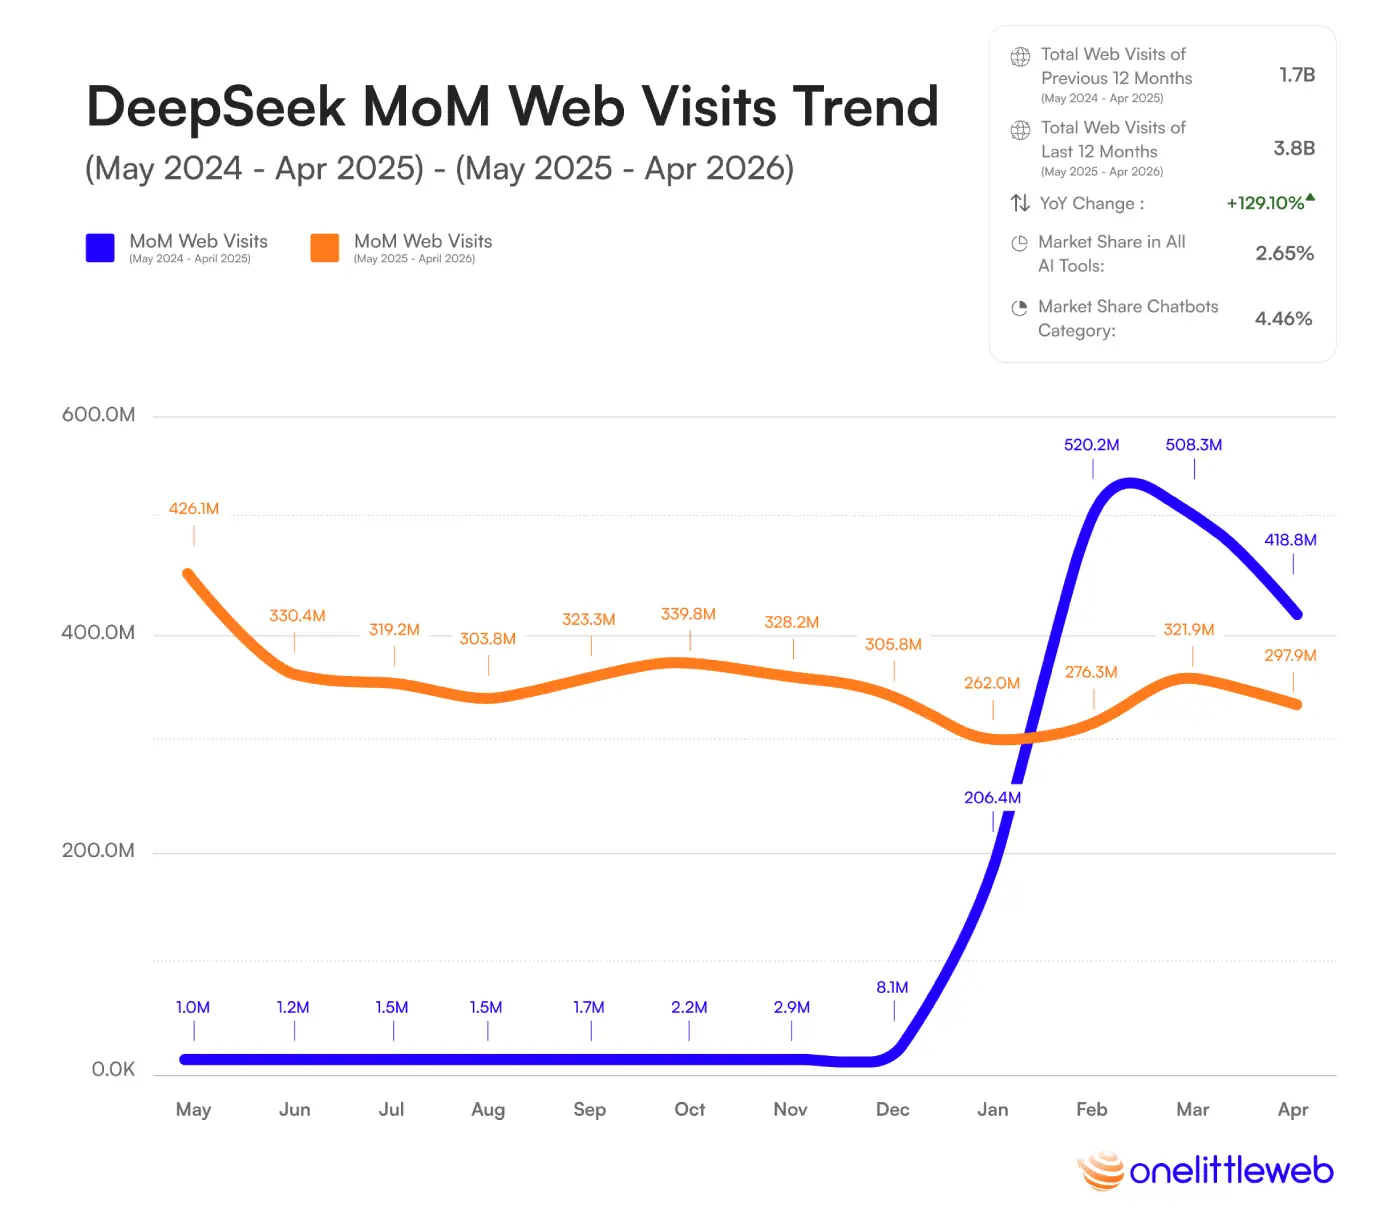
From Google Translate’s gradual decline, we move to almost the opposite story. DeepSeek was barely visible through most of 2024, attracting only 1–8 million monthly web visits. Then its audience expanded almost overnight, pushing the AI tool into fifth place with 3.8 billion web visits over the latest 12 months.
DeepSeek’s monthly web visits jumped from 8.1 million in December 2024 to 520.2 million in February 2025, a rise of more than 64 times in just two months.
The full 24-month trend shows that the breakout did not continue at the same speed. After reaching 520.2 million visits in February 2025, DeepSeek gradually settled into a lower range, generally recording between 262 million and 340 million monthly visits through most of the latest 12 months. It ended the period at 297.9 million visits in April 2026, still far above where it began but well below its initial peak.
That distinction matters when we look at its 129.10% year-over-year growth. DeepSeek did more than experience a brief surge, it retained a much larger audience afterward, but most of its rise came from one sharp turning point rather than steady month-by-month expansion. And while it has secured a place among the largest AI tools, ChatGPT still generated roughly 17 times more web visits over the same 12 months.
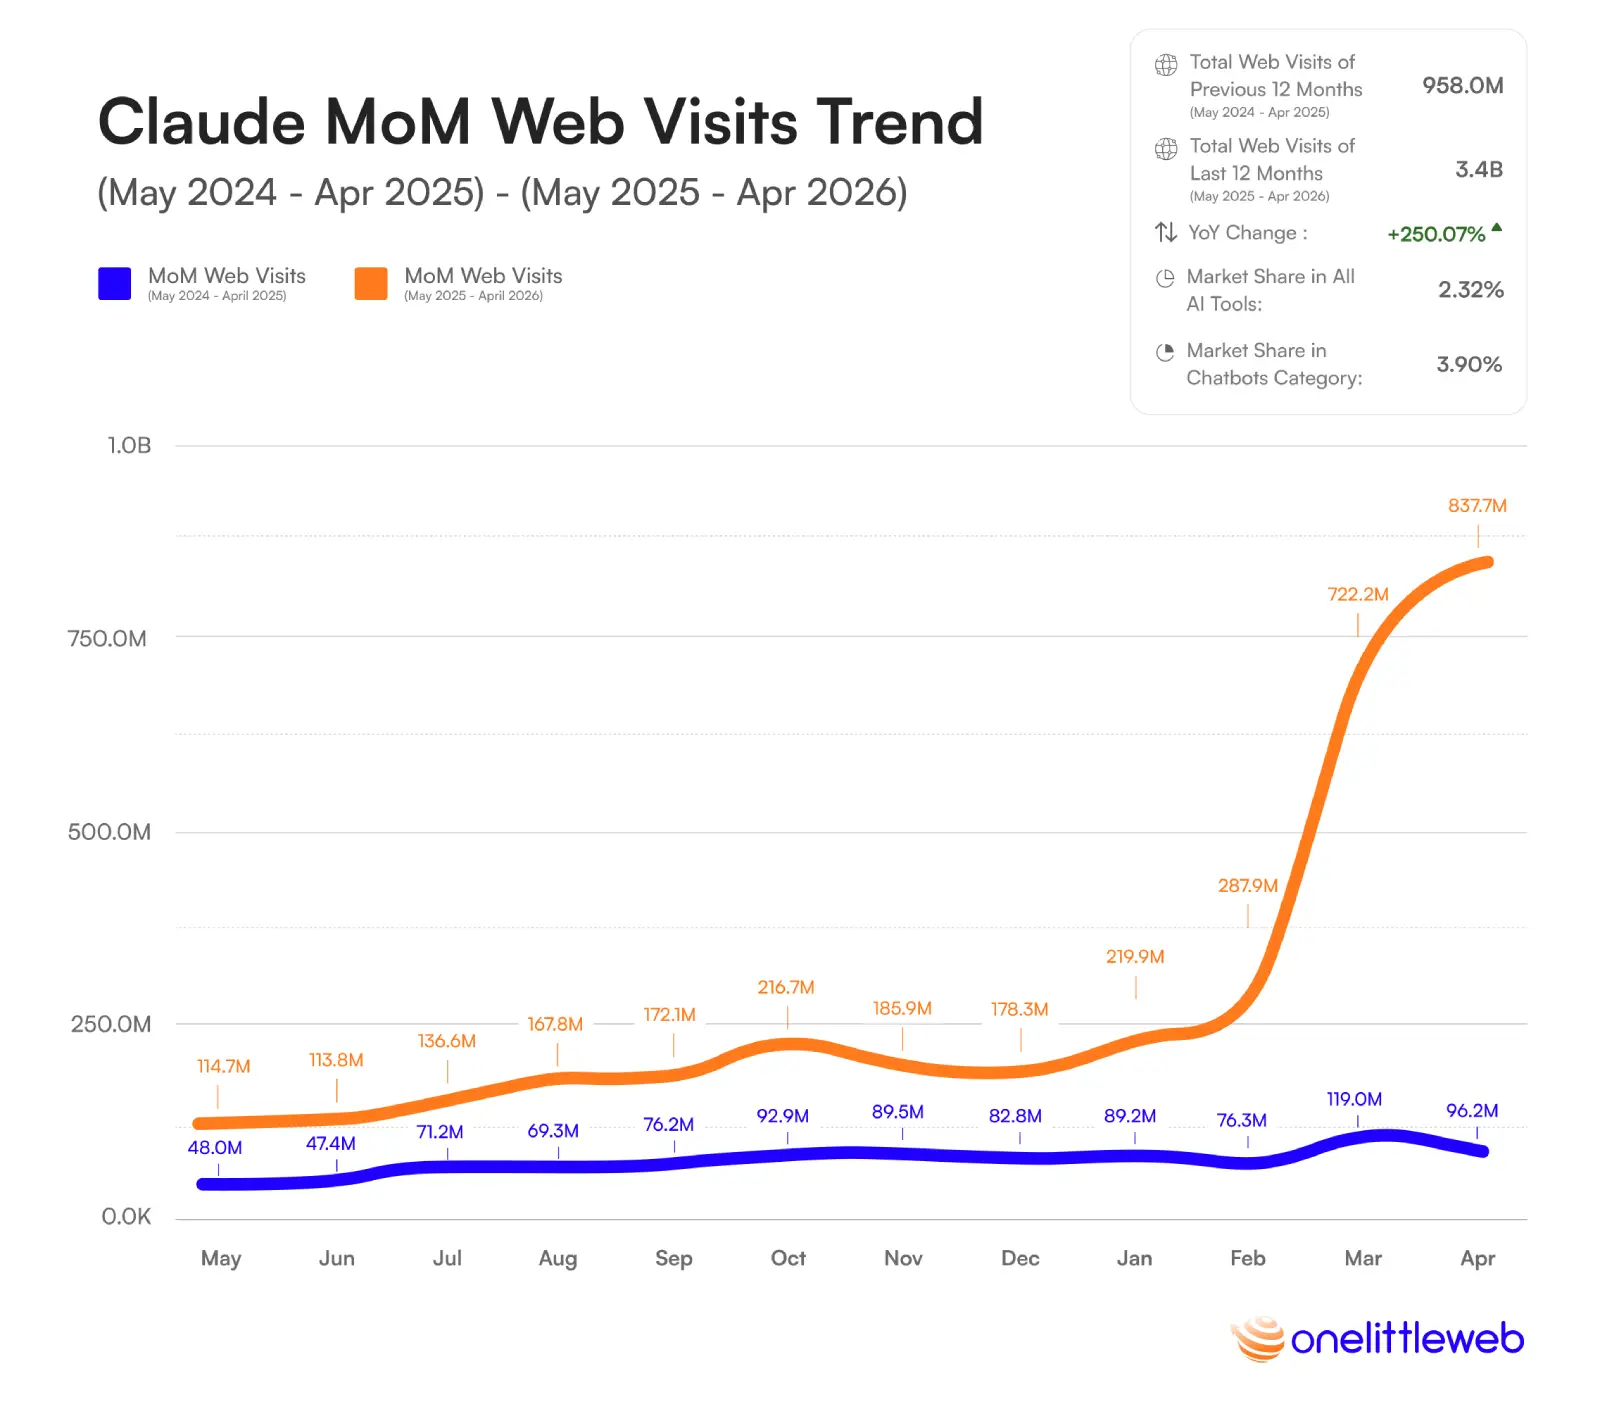
If DeepSeek’s rise was shaped by one sudden breakout, Claude followed a very different path. For most of the 24 months we tracked, its web visits increased gradually, moving from 48.0 million in May 2024 to around 220 million by early 2026. Then the trend changed sharply.
From May 2025 to April 2026, Claude generated 3.4 billion web visits, compared with Grok’s 2.5 billion. That gave Claude roughly 879.2 million more visits, or 35.5% more than Grok over the same 12-month period.
When we looked at the full trend, those final two months stood out immediately. Claude had recorded 287.9 million web visits in February 2026, which means its monthly visits nearly tripled by April. Unlike DeepSeek, whose initial surge gradually cooled, Claude ended our study period at its highest point.
That late acceleration helped Claude grow from 958.0 million to 3.4 billion annual web visits, an increase of 250.07%. The data does not tell us exactly what caused the sharp rise, but it does show that Claude’s momentum was still building when the study period ended. That makes its next few months particularly worth watching as it competes with Gemini, DeepSeek, Grok, and Perplexity for a larger share of chatbot use.
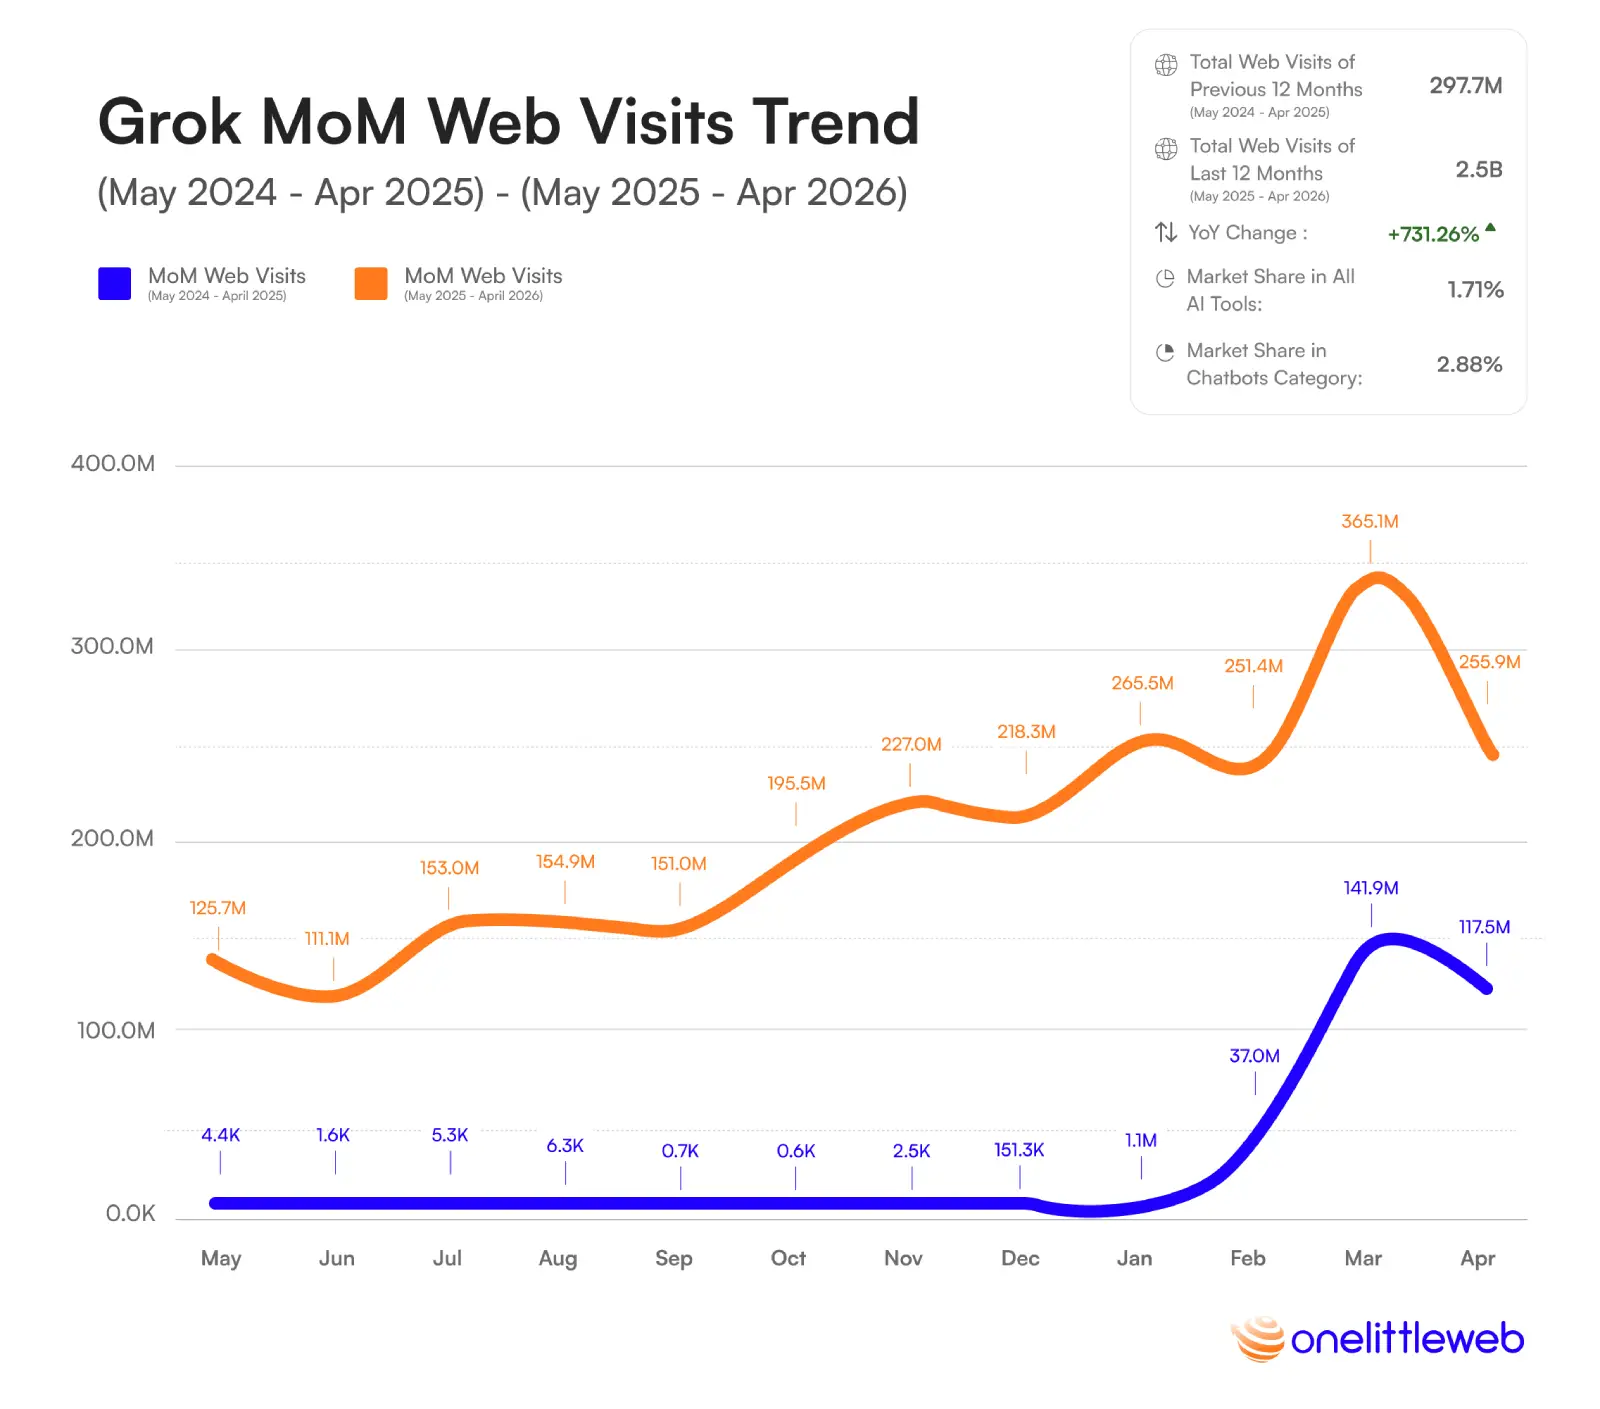
Grok follows Claude in the ranking, but its growth story looks very different. It generated 2.5 billion web visits from May 2025 to April 2026, up from just 297.7 million during the previous 12 months. That 731.26% year-over-year increase made Grok the fastest-growing AI tool among the Top 10.
Grok generated 2.5 billion web visits from May 2025 to April 2026, more than eight times the 297.7 million visits it recorded in the previous 12 months. Its 731.26% growth rate was the highest among the Top 10 AI tools.
When we looked at the monthly trend, Grok’s growth was strongest in the second half of the latest period. Monthly web visits increased from 125.7 million in May 2025 to 227.0 million in November, then reached 265.5 million in January 2026 before peaking at 365.1 million in March. Visits fell to 255.9 million in April but remained more than twice their level at the start of the period.
Grok’s growth rate is striking, but scale still separates it from the larger chatbot leaders. Claude generated 3.4 billion web visits during the same 12 months, roughly 879.2 million more than Grok, while DeepSeek generated 3.8 billion. Grok is gaining ground quickly, but it has not yet caught the AI tools immediately above it in the ranking.
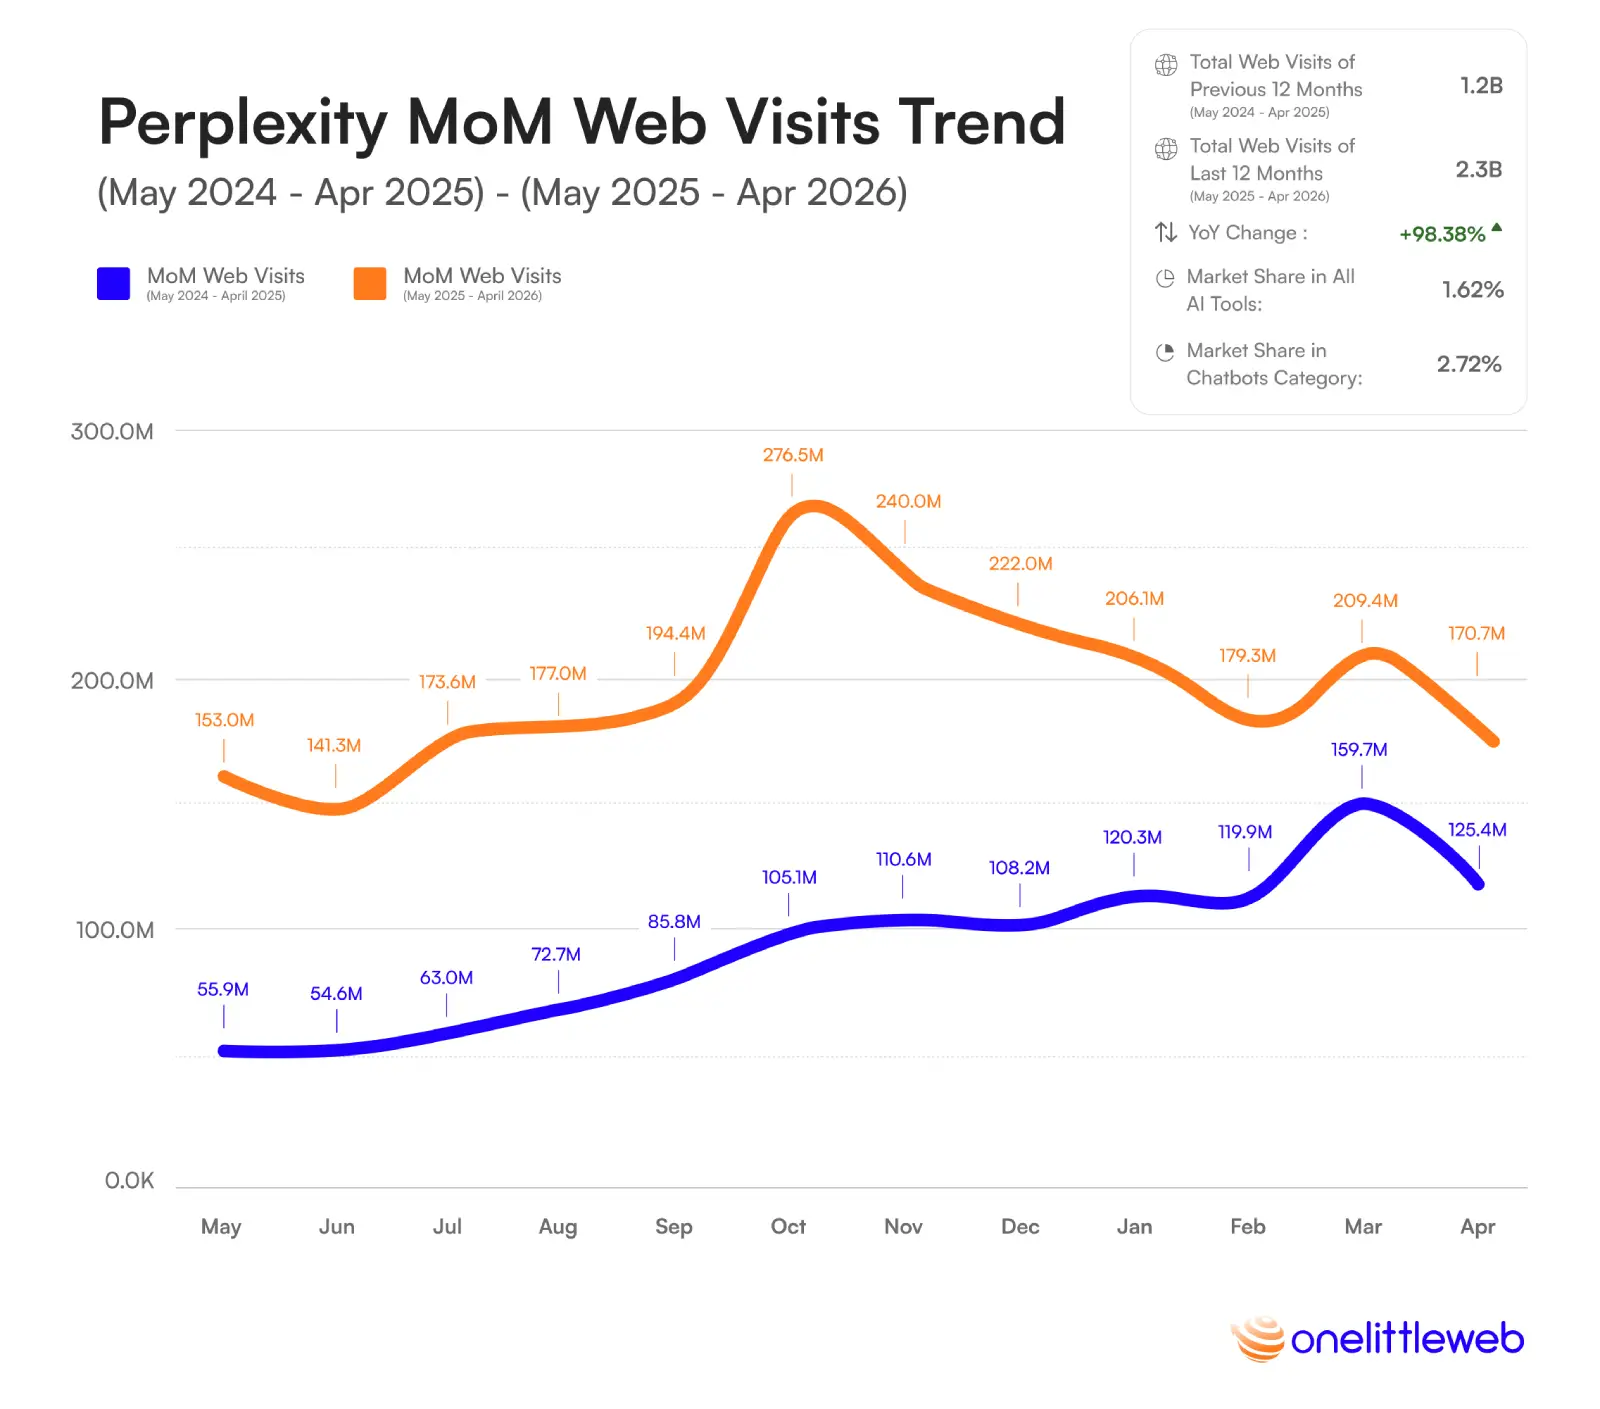
As we move from Grok to Perplexity, the growth pattern becomes more mixed. Perplexity generated 2.3 billion web visits over the latest 12 months, almost double the 1.2 billion visits it recorded during the previous period.
Perplexity added 1.16 billion web visits year over year, almost as many as Microsoft Copilot generated during the entire latest 12-month period at 1.21 billion.
The 24-month trend shows a clear rise through most of 2024 and 2025. Monthly web visits increased from 55.9 million in May 2024 to a record 276.5 million in October 2025. From there, growth began to cool. Visits fell to 240.0 million in November, declined further to 179.3 million in February 2026, recovered briefly in March, and ended at 170.7 million in April.
Perplexity still finished the year with 98.38% growth and generated almost twice as many web visits as Microsoft Copilot during the same period. But unlike Gemini, Claude, and Grok, its strongest momentum came earlier in the year. The next phase will depend on whether Perplexity can turn its growing position in AI search and research into another sustained rise rather than relying on the gains already made.
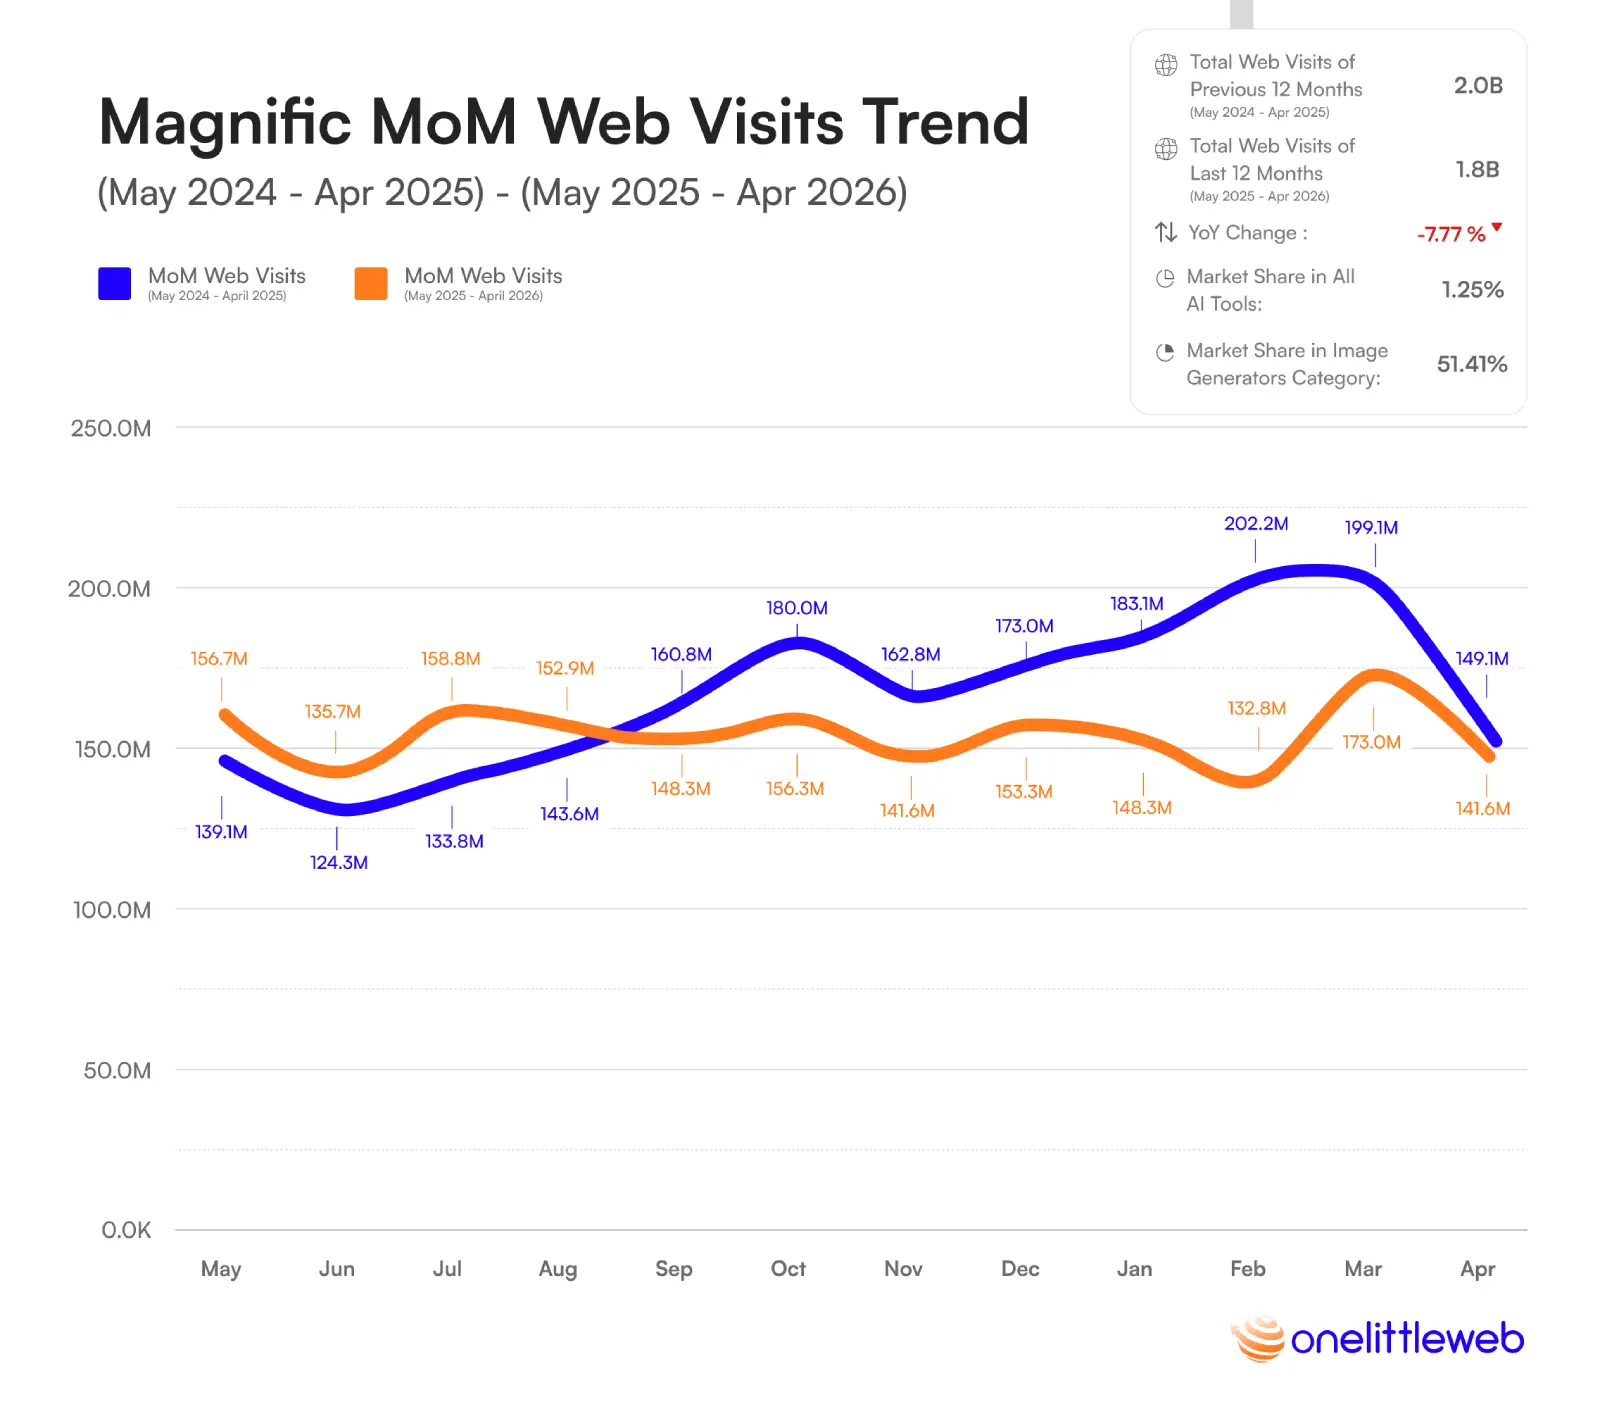
As we move beyond chatbots, Magnific (formerly FreePik) gives us a very different picture of AI adoption. It generated 1.8 billion web visits from May 2025 to April 2026, making it the most-visited AI image generator in our study, even after losing 151.6 million visits year over year.
Magnific (formerly FreePik) captured 50.94% of all web visits in the Image Generators category, meaning more than half of the category’s web visits went to a single AI tool, even after its annual web visits declined by 7.77%.
Its monthly trend was relatively stable rather than sharply falling. Web visits generally remained between 132.8 million and 173.0 million throughout the latest 12 months, compared with an average of roughly 162.6 million per month during the previous year. The decline was real, but gradual, with no single collapse driving the annual result.
What stands out to us is how firmly Magnific (formerly FreePik) still leads its category. SeaArt.ai, the second-largest AI image generator, recorded 292.7 million web visits, which means Magnific (formerly FreePik) generated more than six times as many. Yet the wider category is becoming more competitive, with SeaArt.ai, PhotoRoom, Midjourney, and several other AI tools continuing to gain web visits while the leader moves slightly backward.
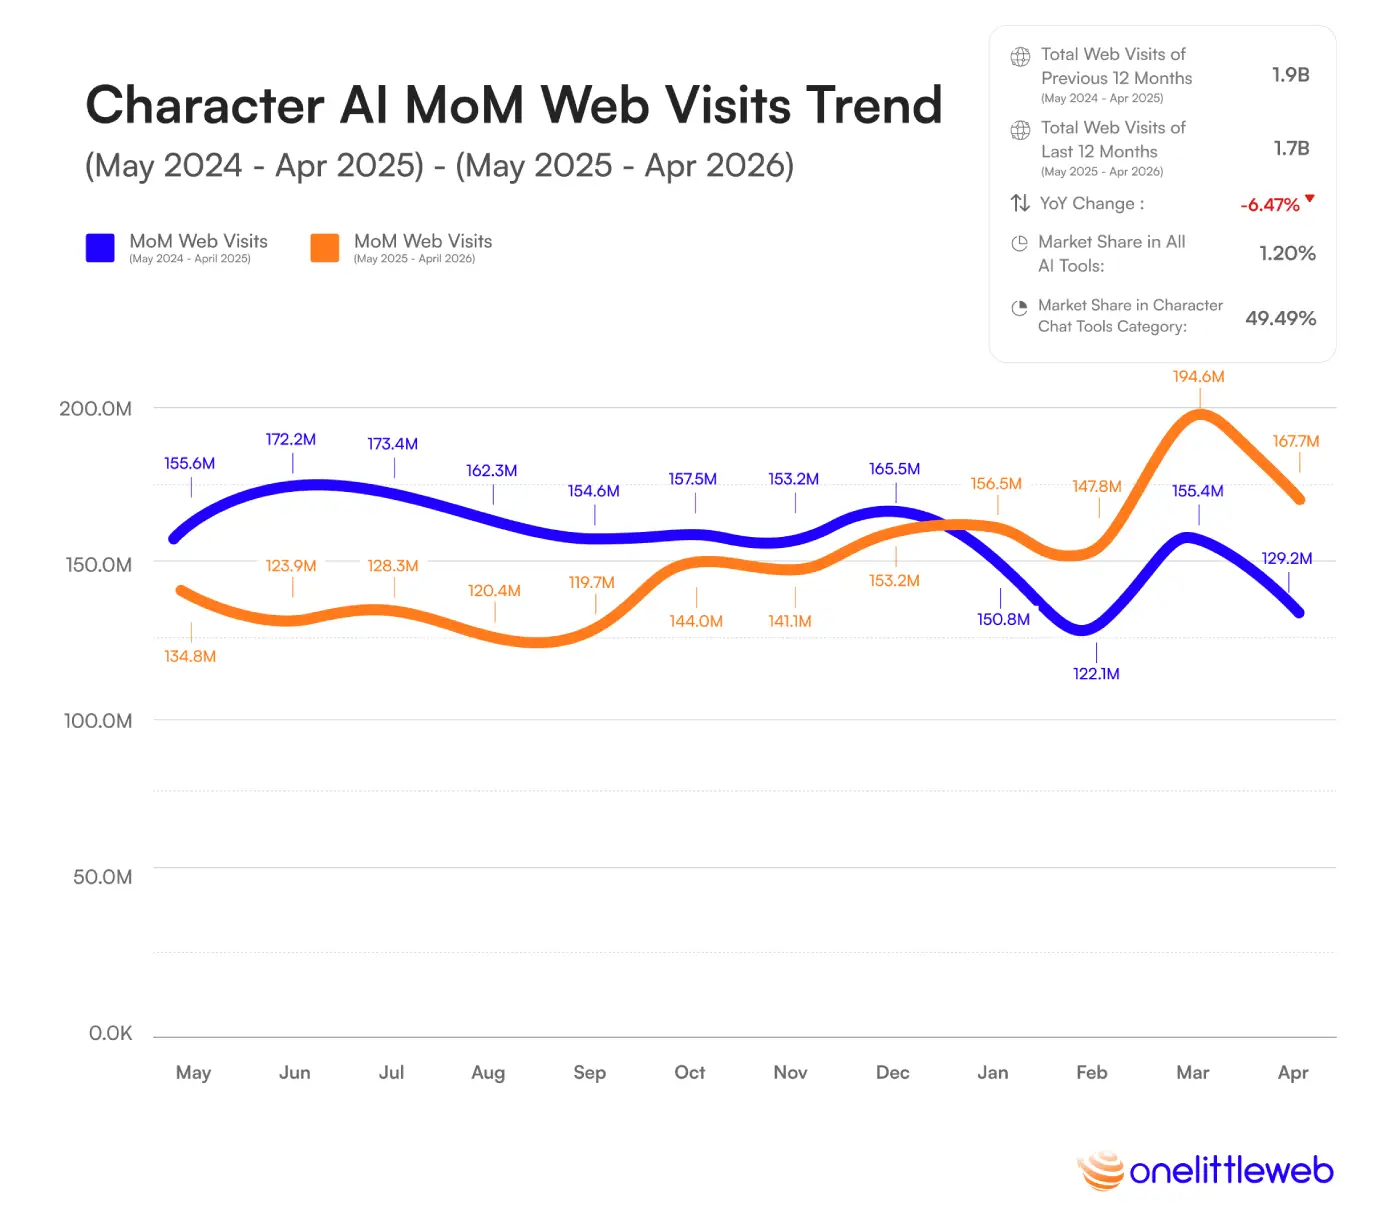
As we move into character-chat tools, Character AI still holds the top position. It generated 1.7 billion web visits over the latest 12 months and captured 49.26% of all web visits in the category. However, its annual web visits fell by 119.8 million, while JanitorAI moved rapidly in the opposite direction.
Character AI remained the key player in the Character Chat Tools category, capturing 49.26% of all category web visits. Even after a 6.47% year-over-year decline, nearly 1 in every 2 web visits of the full category still went to Character AI.
The monthly data shows that Character AI did not experience a steady collapse. Its web visits mostly moved between 119.7 million and 167.7 million during the latest year, before reaching a 24-month high of 194.6 million in March 2026. That late increase helped it maintain first place, but it was not enough to offset weaker performance across the full 12 months.
What stood out to us most was how quickly the balance inside this category changed. Character AI and JanitorAI now account for 93.98% of all character chat tools’ web visits, making this essentially a two-tool market. Character AI remains ahead, but JanitorAI’s 53.14% growth has turned what was once a comfortable lead into a much closer race.
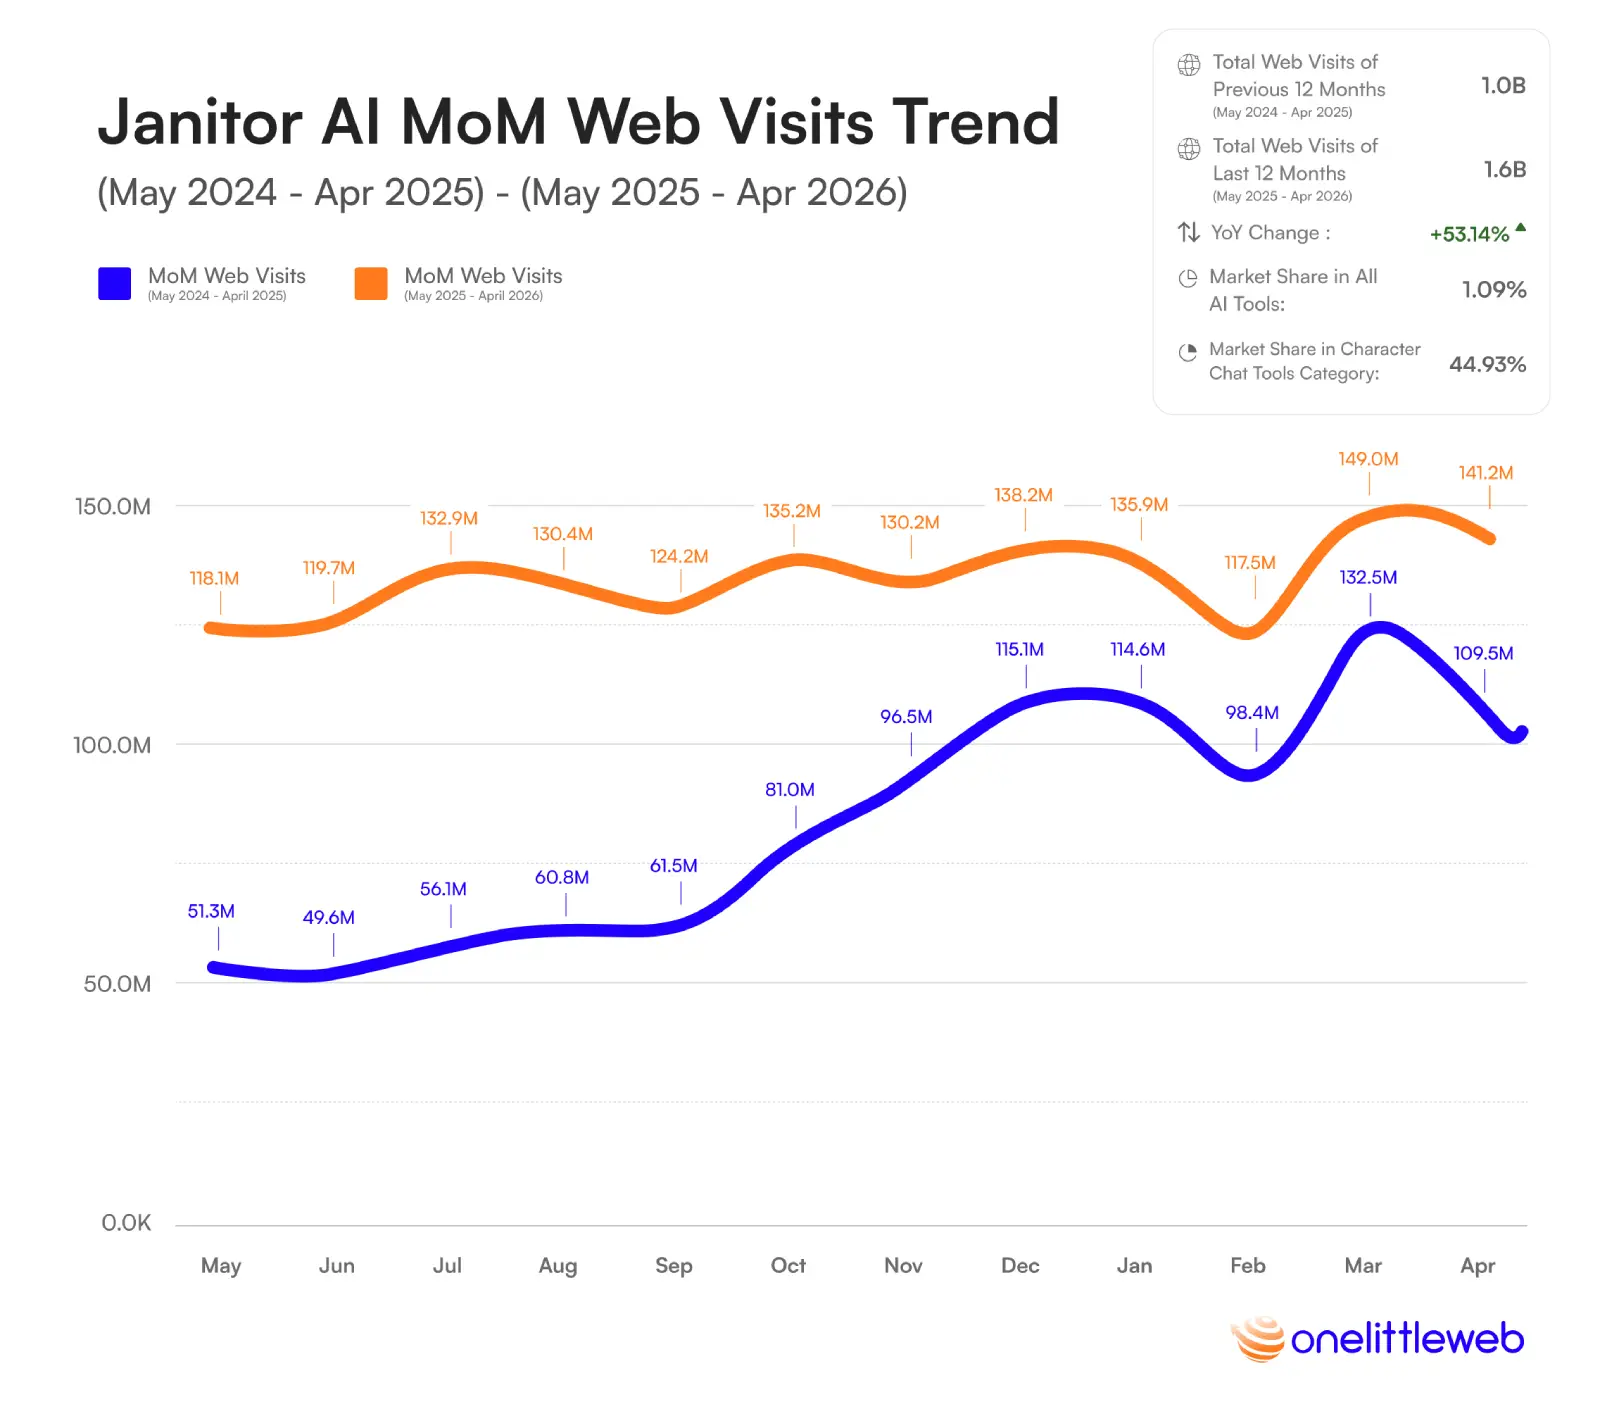
That brings us directly to the AI tool reshaping the Character Chat Tools category. JanitorAI generated 1.6 billion web visits over the latest 12 months, up from 1.0 billion, and added 545.6 million visits year over year.
JanitorAI added 545.6 million web visits in one year, lifting its annual total from 1.03 billion to 1.57 billion. Its monthly web visits also rose from 51.3 million in May 2024 to 141.2 million in April 2026, nearly 2.8 times higher.
When we looked at the monthly trend, JanitorAI’s growth appeared much steadier than a one-time surge. Monthly web visits rose from 51.3 million in May 2024 to 141.2 million in April 2026, with several months above 130 million during the latest period. Its highest month came in March 2026, when it reached 149.0 million visits.
What makes this especially interesting is how concentrated the category has become. JanitorAI and Character AI together accounted for 93.98% of all Character Chat Tools web visits. Character AI still holds the lead, but JanitorAI’s 53.14% year-over-year growth has turned the category into a much closer two-tool contest.
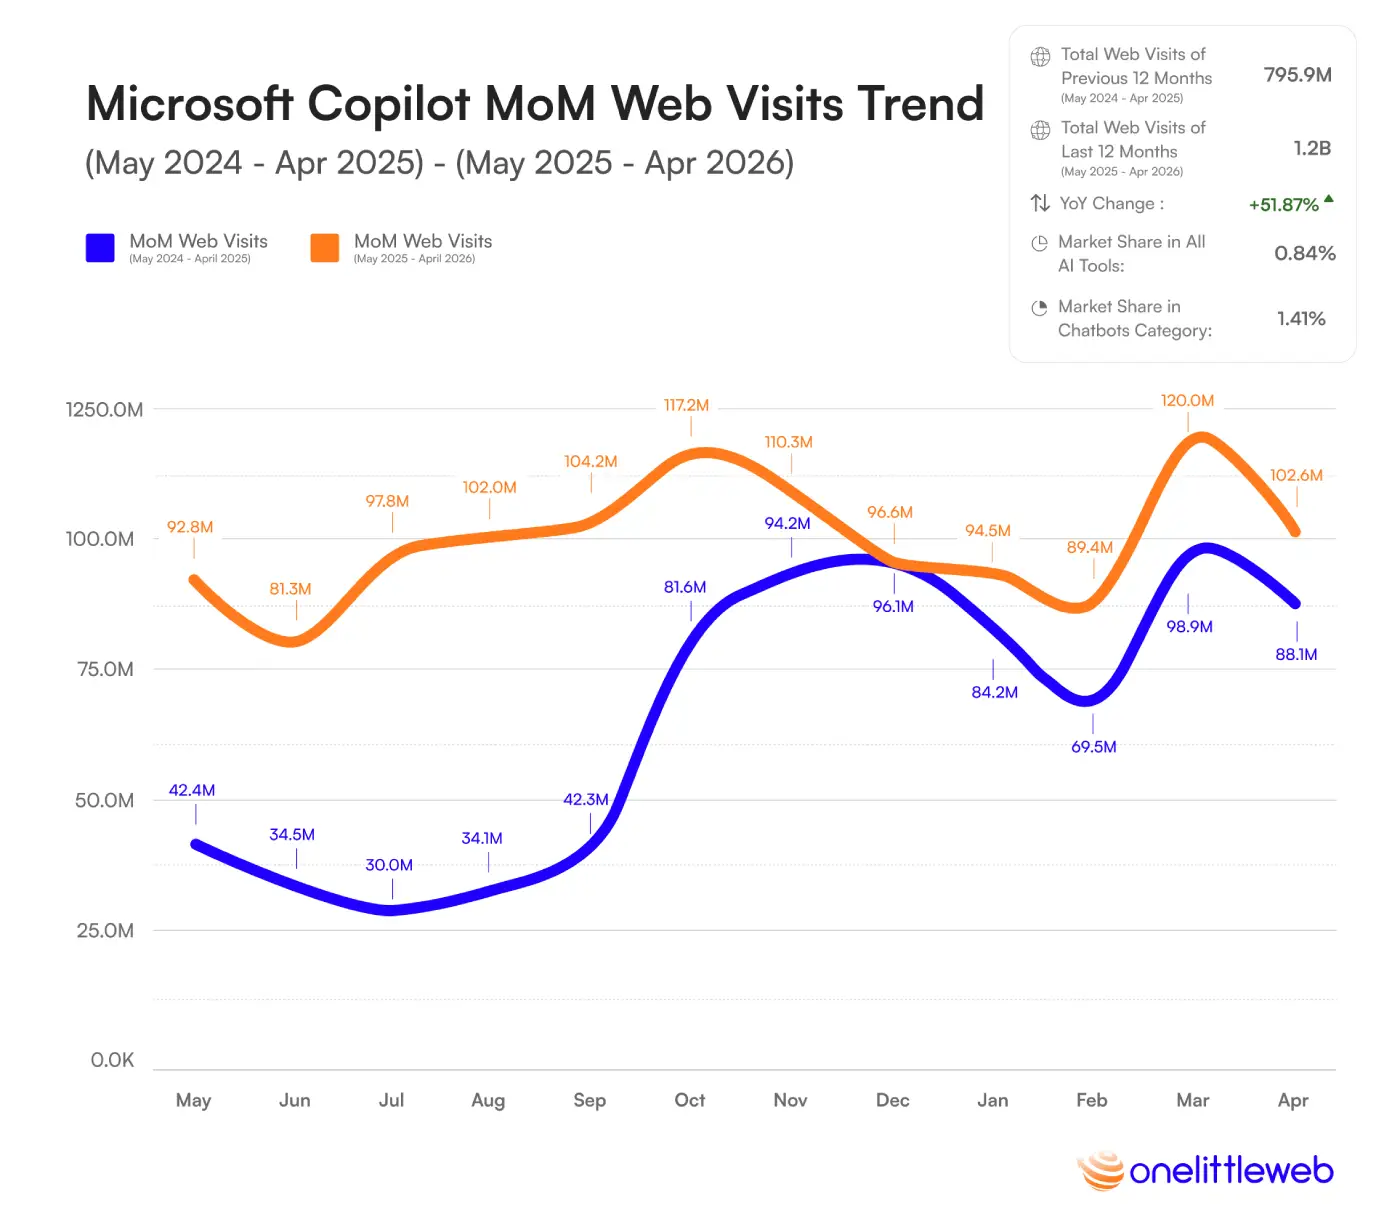
From character-chat tools, we return to a very different kind of chatbot. Microsoft Copilot generated 1.2 billion web visits from May 2025 to April 2026, up from 795.9 million the year before. That added 412.8 million visits and lifted annual web visits by 51.87%.
Microsoft Copilot’s monthly web visits flow more than doubled. Its weakest month in the latest 12-month period still generated 81.3 million web visits, compared with a low of 30.0 million during the previous year.
When we reviewed the monthly trend, Copilot’s growth looked steadier than many of the chatbot breakouts above it. Web visits generally stayed between 81 million and 120 million throughout the latest 12 months, reaching a high of 120.0 million in March 2026. There was no single month responsible for most of the increase. Instead, Copilot moved into a consistently higher range and remained there.
That pattern fits how people encounter Copilot. Rather than functioning only as a standalone chatbot, it is positioned around workplace tasks such as writing, summarizing, coding, and document creation across Microsoft products. Its growth may look less dramatic than Gemini, Claude, or Grok, but the data shows a broader base of recurring web visits taking shape.
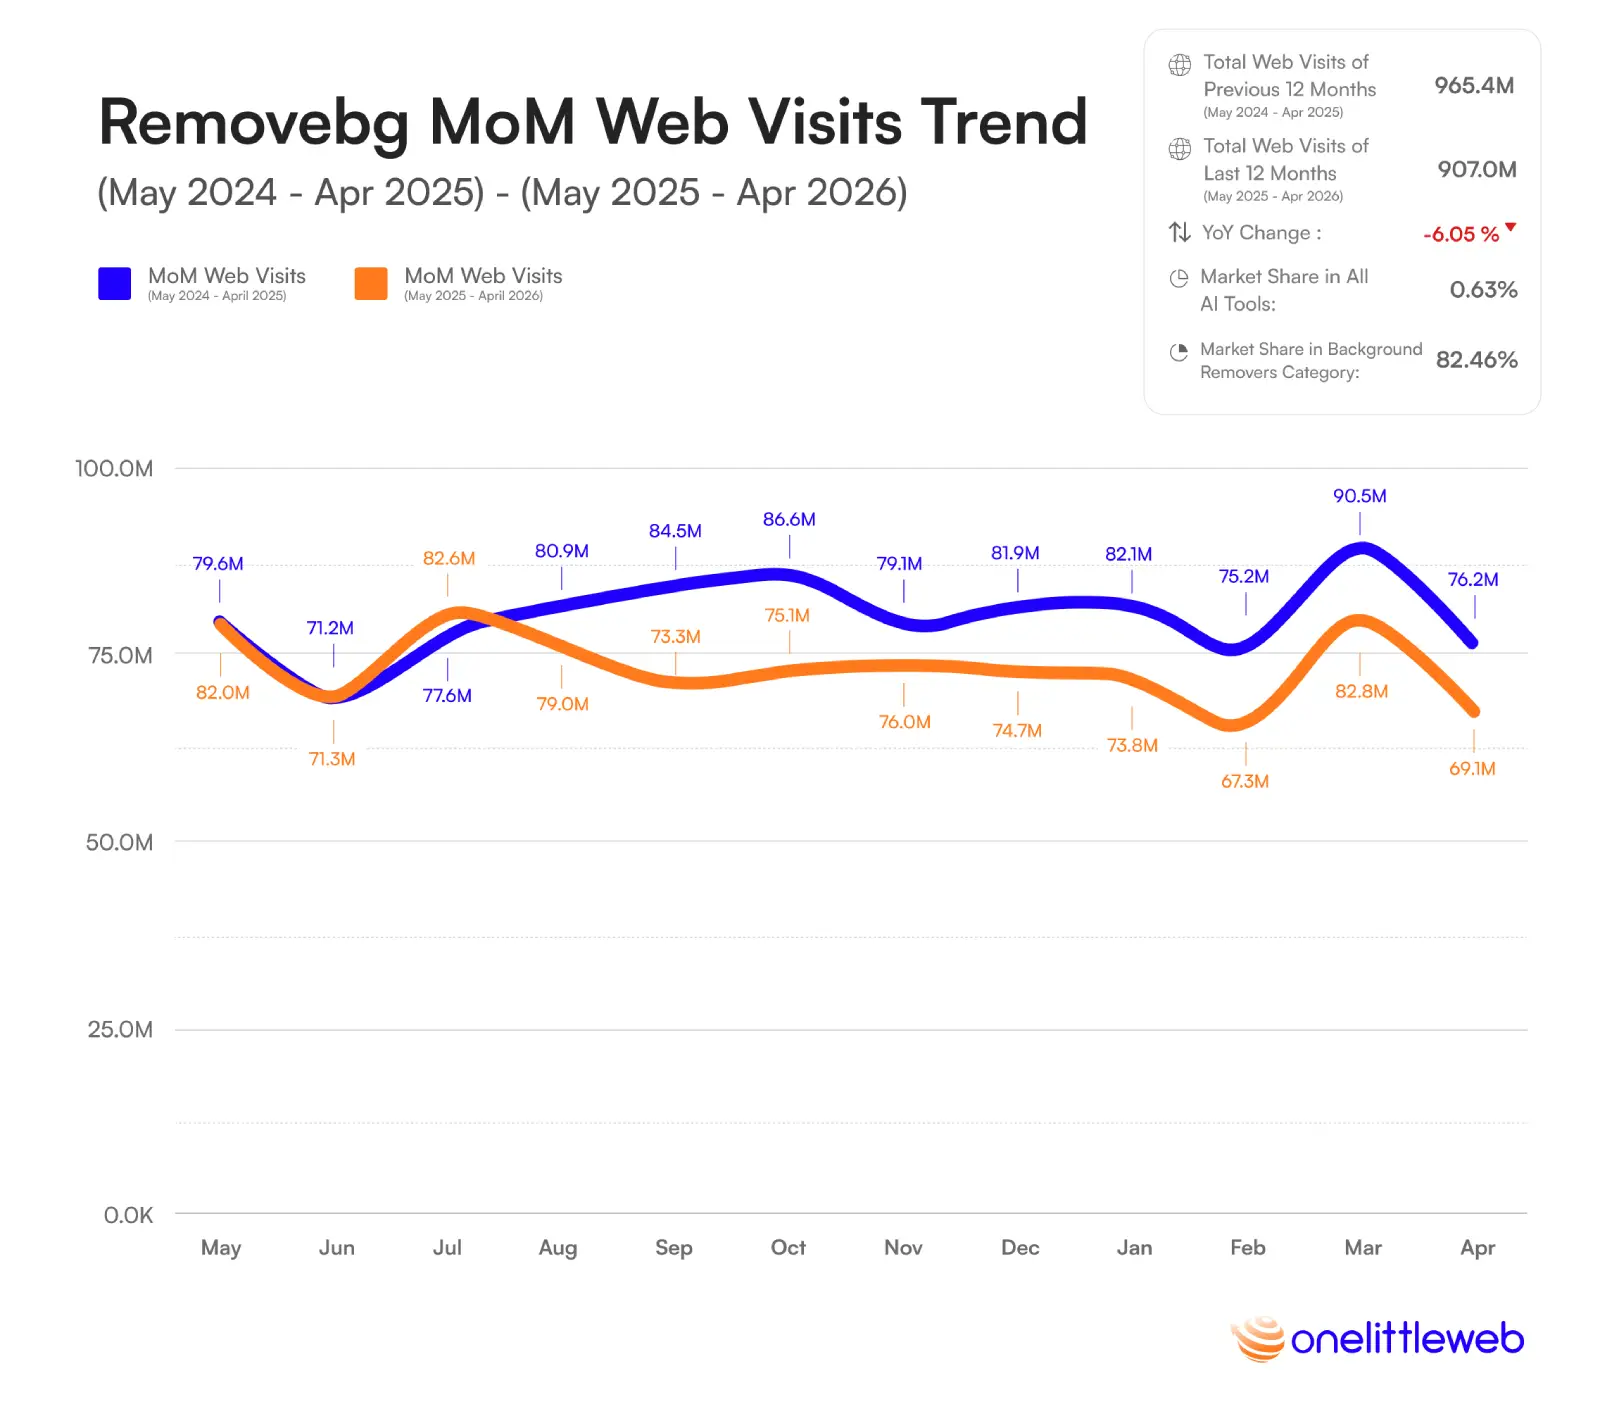
After several broad-use AI tools, Remove.bg takes us in the opposite direction. It focuses on one narrow task, removing image backgrounds, yet still generated 907.0 million web visits over the latest 12 months.
Remove.bg captured 82.46% of all web visits in the Background Removers category, even after its annual web visits declined by 6.05%.
When we looked at the full 24-month trend, the decline appeared gradual rather than sudden. Remove.bg generated between 71.2 million and 90.5 million monthly web visits during the previous year. In the latest period, monthly visits mostly stayed between 67.3 million and 82.8 million, showing that usage moved into a slightly lower but still remarkably stable range.
What stands out here is how durable a highly specialized AI tool can remain. Remove.bg lost 58.4 million annual web visits, but no competitor came close to challenging its category lead. While many users now access image editing features inside larger creative tools, most standalone background-removal visits still flow to the AI tool that became closely associated with the task itself.
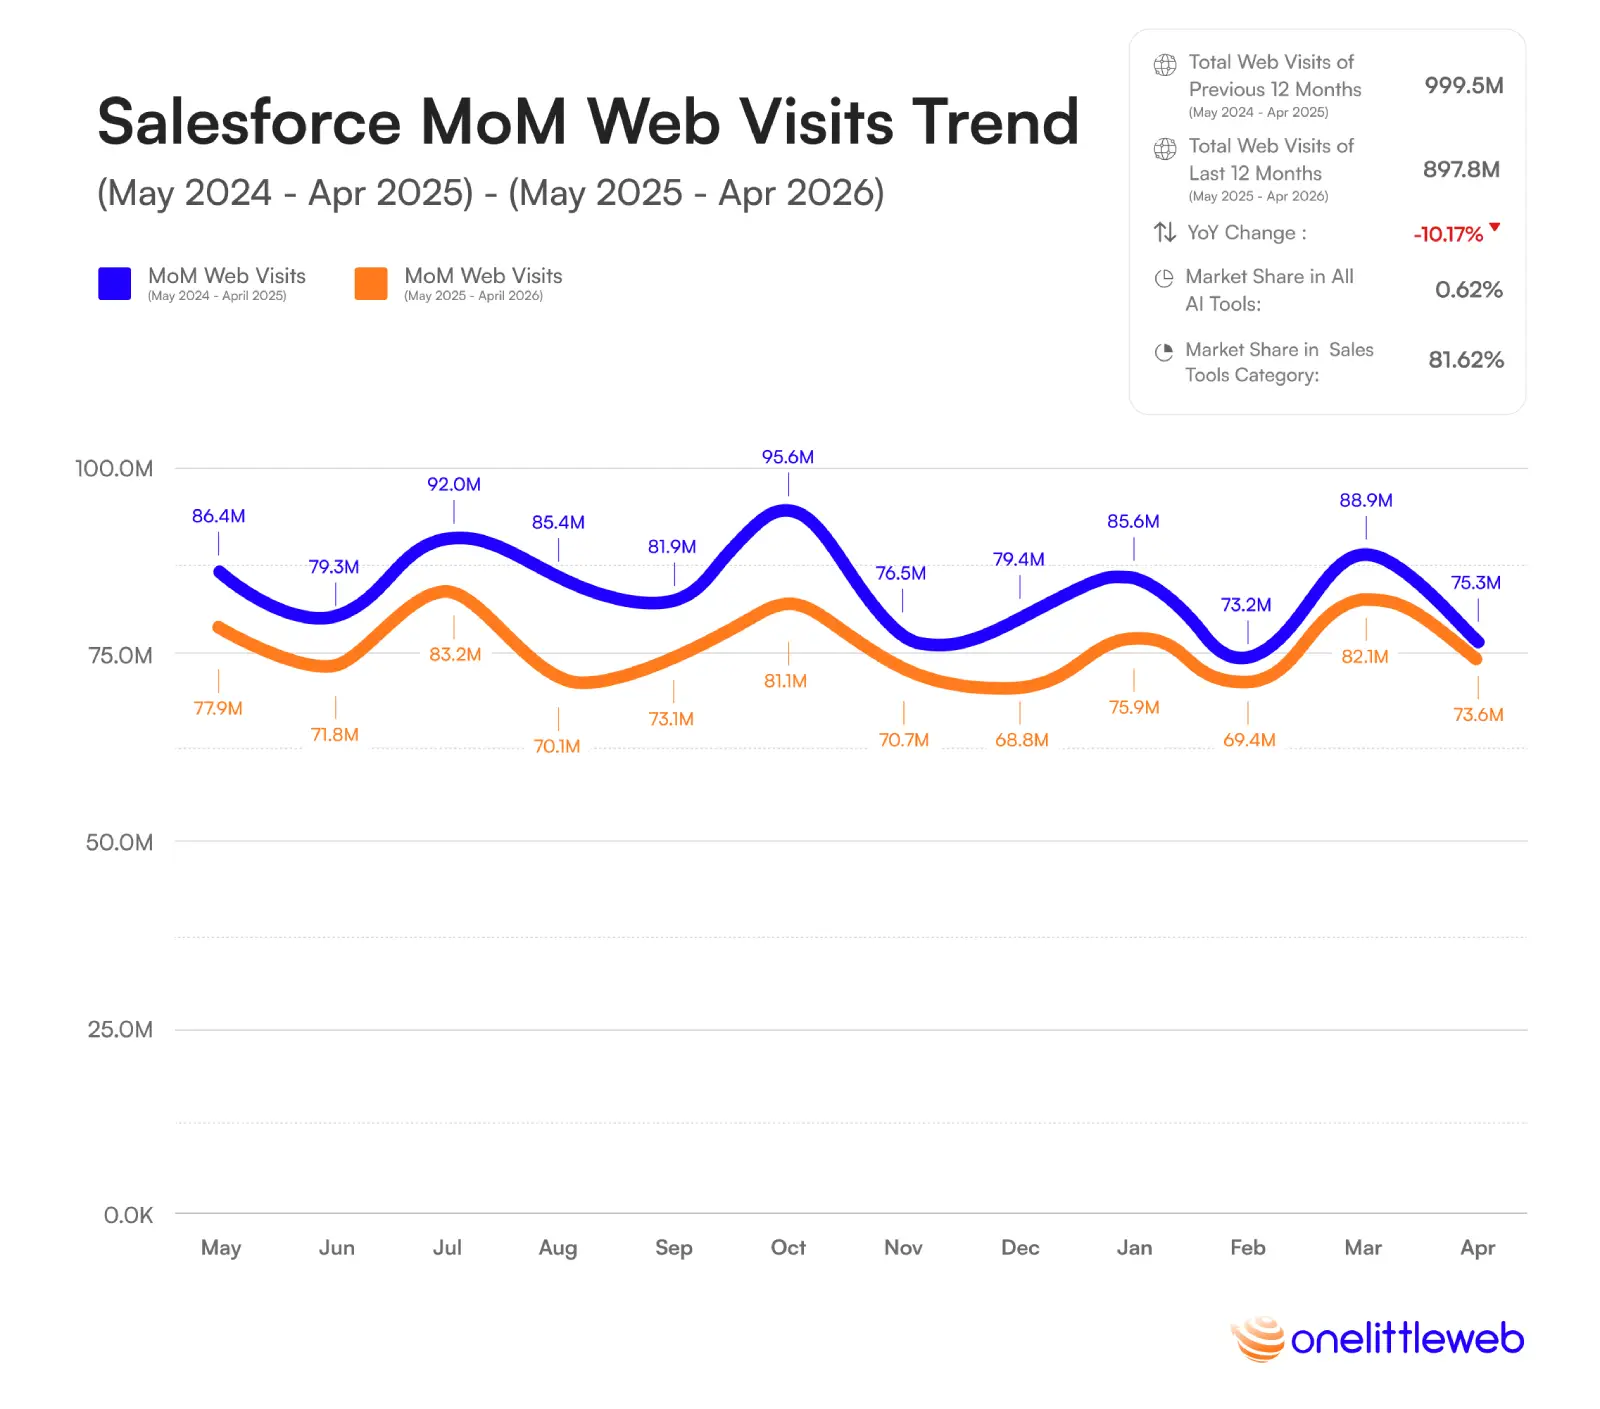
From Remove.bg, we move to another AI tool that still dominates its category despite losing web visits. Salesforce generated 897.8 million web visits over the latest 12 months, down from 999.5 million, a decline of 101.6 million visits.
Salesforce lost 101.6 million web visits year over year, more than it generated in any single month across the full 24-month study period.
That makes the decline more meaningful than a weak annual total caused by one or two poor months. Salesforce’s monthly web visits stayed between 68.8 million and 83.2 million during the latest period, but none of those months surpassed the same month in the previous year. The data points to a steady softening in web visits rather than a sudden drop followed by recovery.
What caught our attention is that Salesforce still controlled 83.66% of all web visits in the Sales Tools category. Its position remains difficult for another sales AI tool to challenge, but category leadership did not translate into growth. In this case, the largest AI tool in the category remained firmly ahead while its own web visits moved consistently backward.
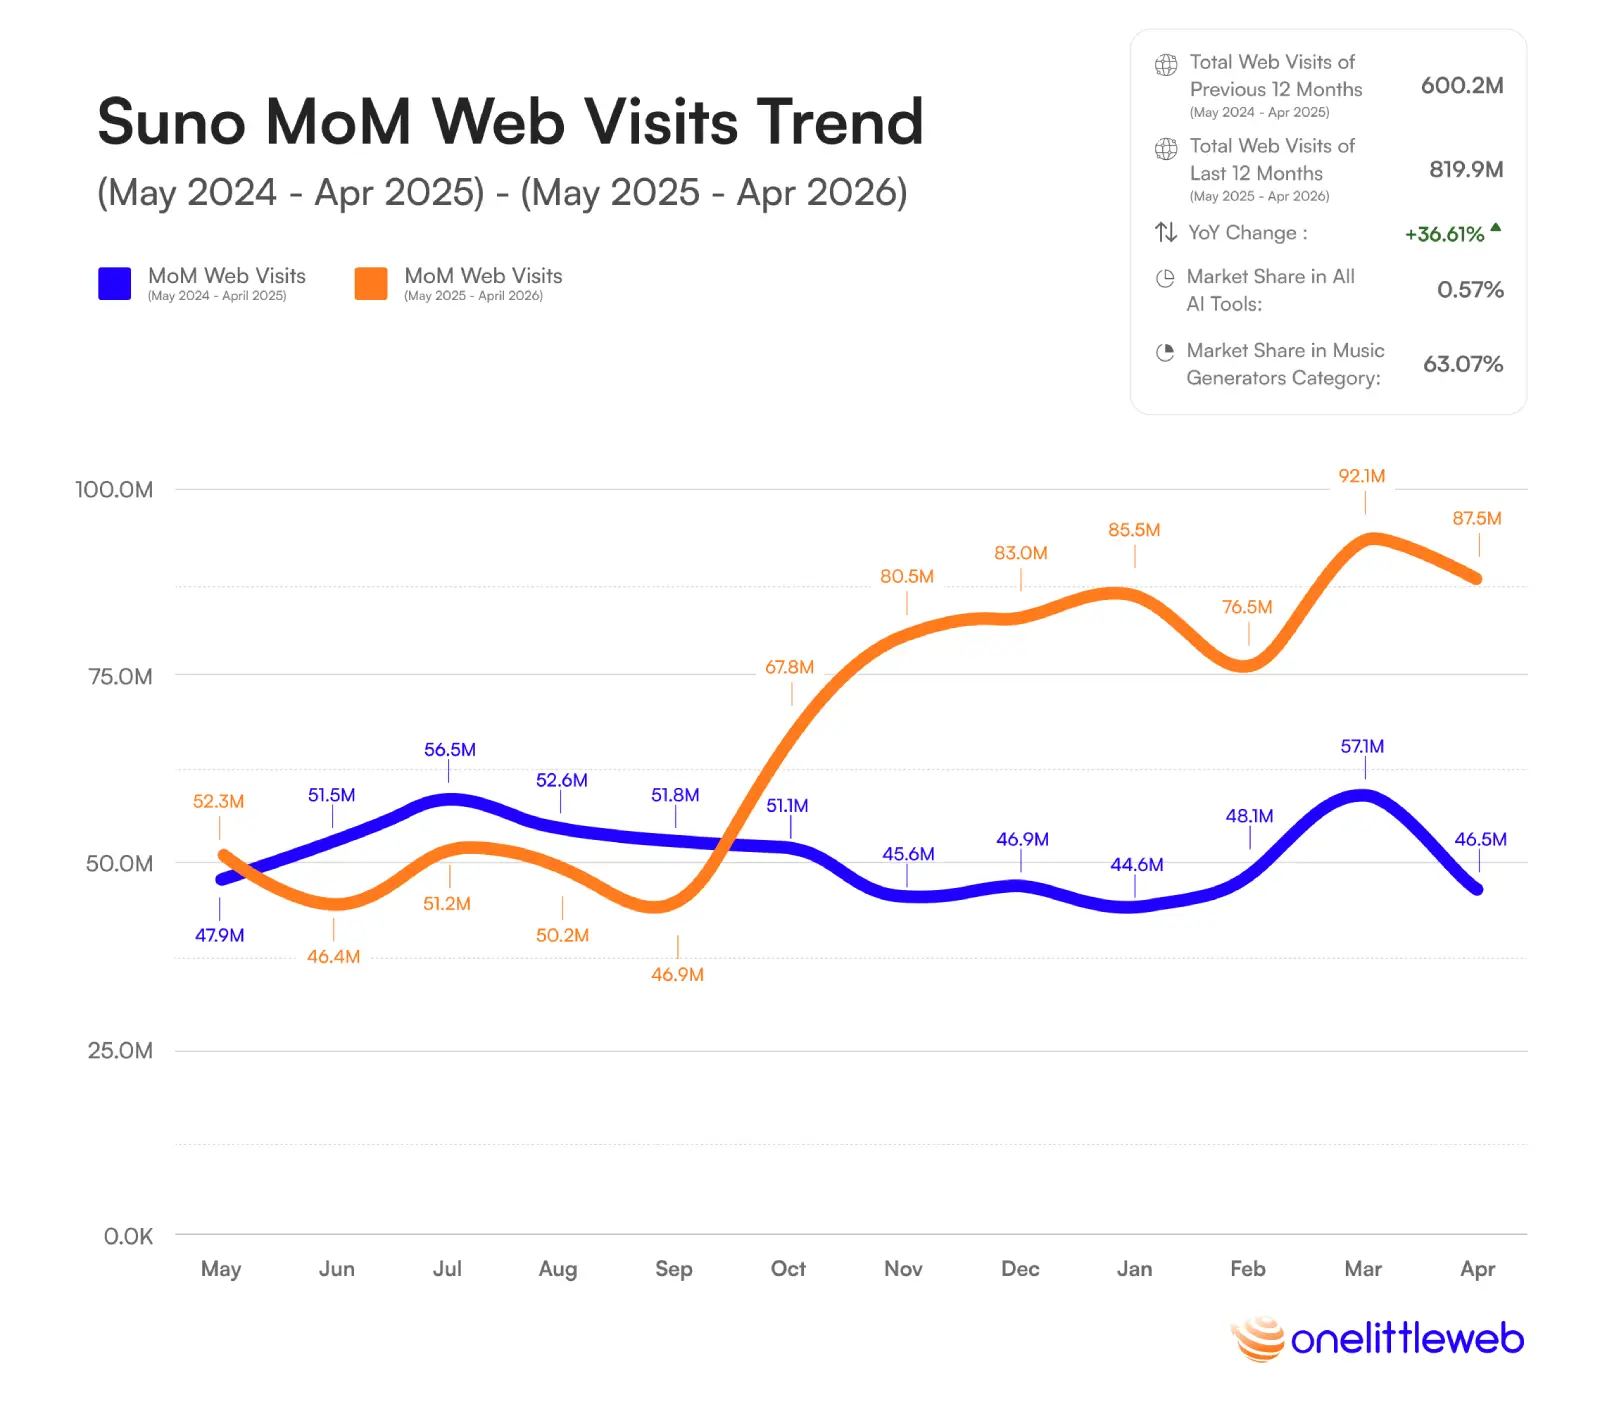
After two category leaders with declining web visits, Suno takes us back to growth. The AI music generator attracted 819.9 million web visits from May 2025 to April 2026, adding 219.7 million visits compared with the previous year.
Key Finding: Suno generated 505.1 million web visits during the final six months of the study, 60.5% more than the 314.8 million visits it received during the first six months of the same period.
That second-half acceleration is easy to see in the monthly data. Suno remained close to 46 million to 52 million monthly web visits from May through September 2025, then climbed to 67.8 million in October, passed 80 million in November, and reached a 24-month high of 92.1 million in March 2026.
What stood out to us is that Suno’s 36.61% annual growth does not fully show how much momentum built near the end of the period. It finished April 2026 with 87.5 million web visits, nearly 88% higher than the 46.5 million visits recorded in April 2025. Rather than relying on one brief spike, Suno moved into a much higher monthly range as the year progressed.
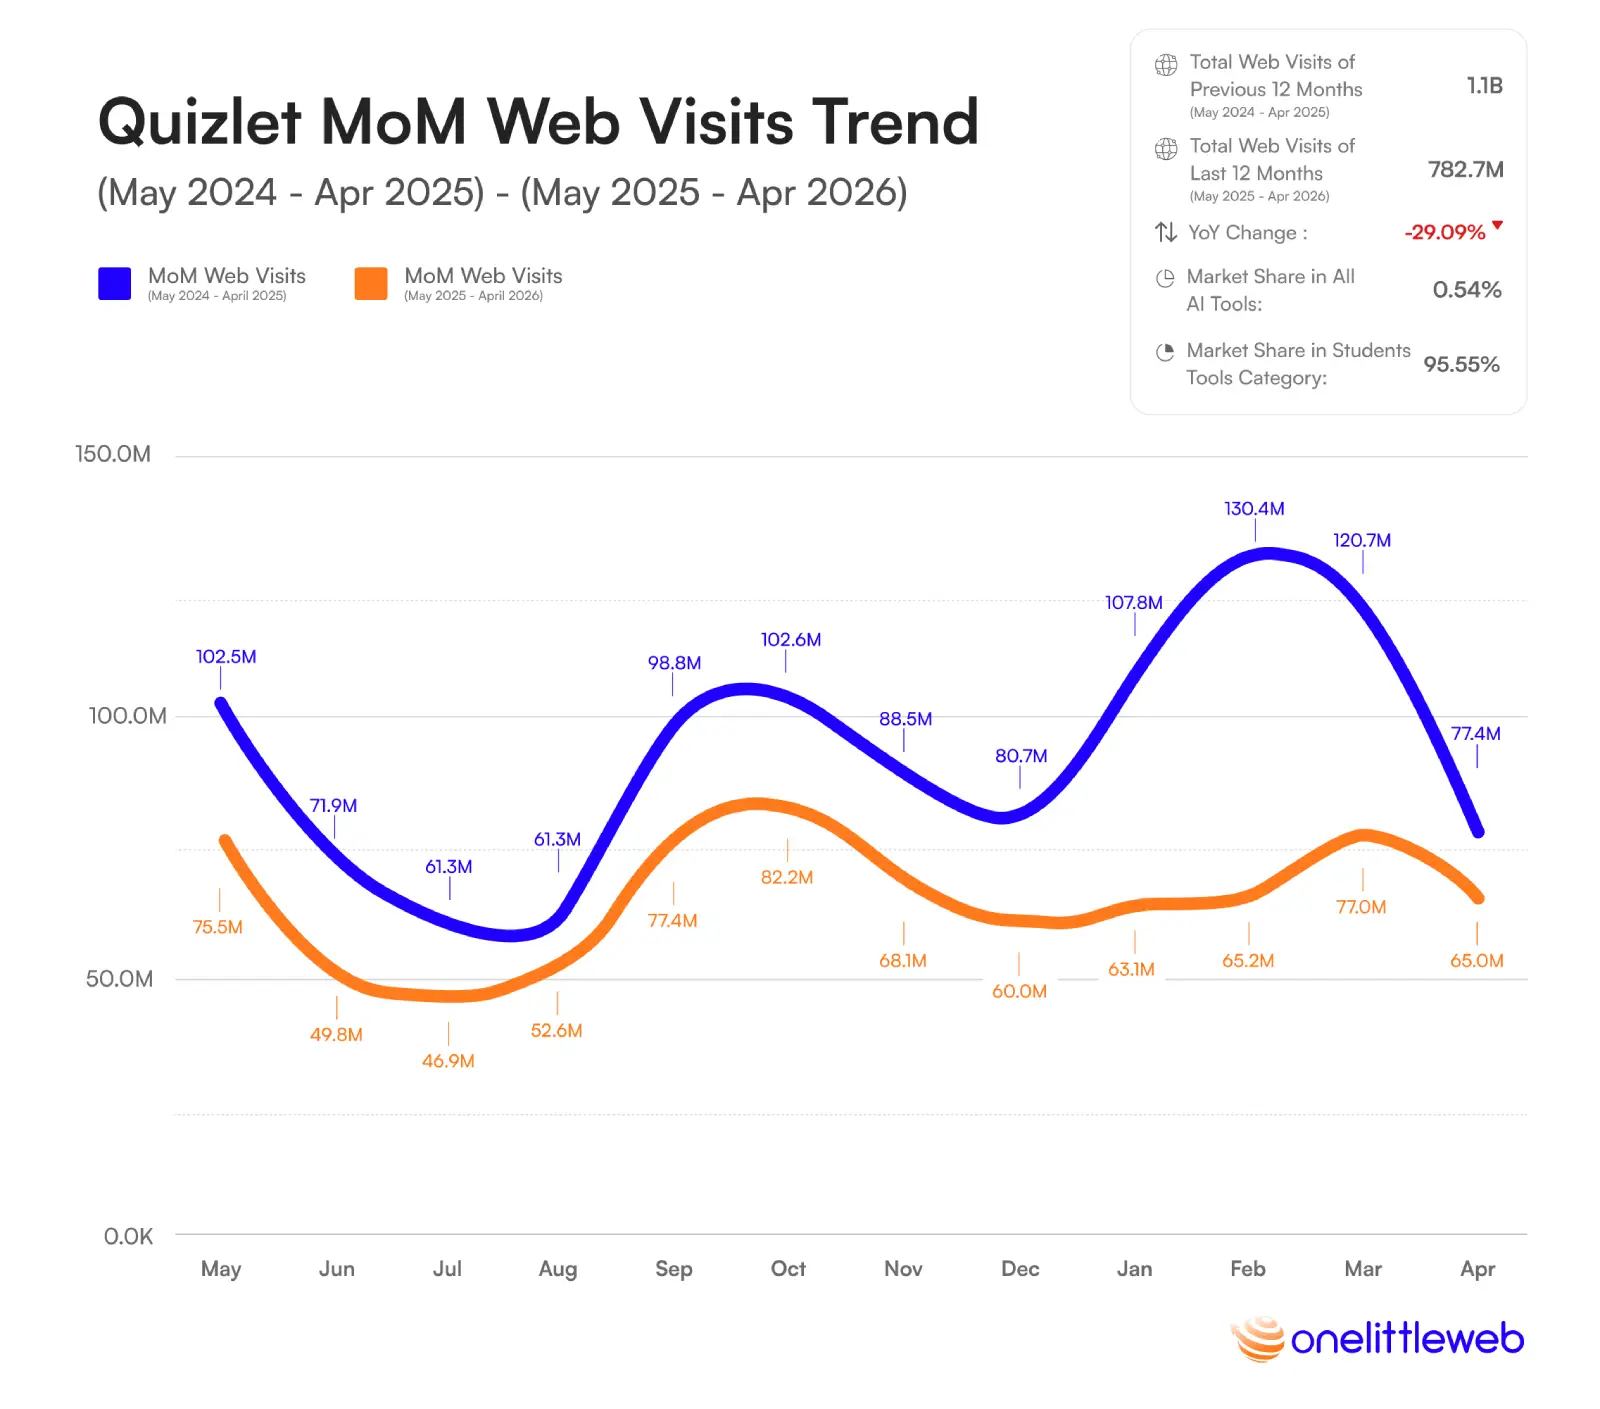
Suno ended the period with growing momentum. Quizlet tells the opposite story. The study tool generated 782.7 million web visits from May 2025 to April 2026, down from 1.1 billion the year before. That meant a loss of 321.1 million visits, one of the largest declines anywhere in the Top 20.
Quizlet recorded the second-largest absolute decline among the Top 20 AI tools, behind only Google Translate. Its February peak fell from 130.4 million web visits in 2025 to 65.2 million in 2026, almost exactly half.
When we compared the two 12-month periods, Quizlet recorded fewer web visits in every month than it had during the same month a year earlier. Its usual academic-season increases were still visible around September, October, and the beginning of the year, but each recovery was weaker than before.
Quizlet still accounted for 95.55% of web visits in the Students’ Tools category, so this was not a case of another study tool taking its lead. Instead, the decline appears to be part of a wider shift affecting student, academic writing, and translation tools. The data cannot tell us exactly where those visits went, but the rise of broader AI tools that can explain lessons, create quizzes, summarize notes, and answer follow-up questions may be changing how students choose to study online.
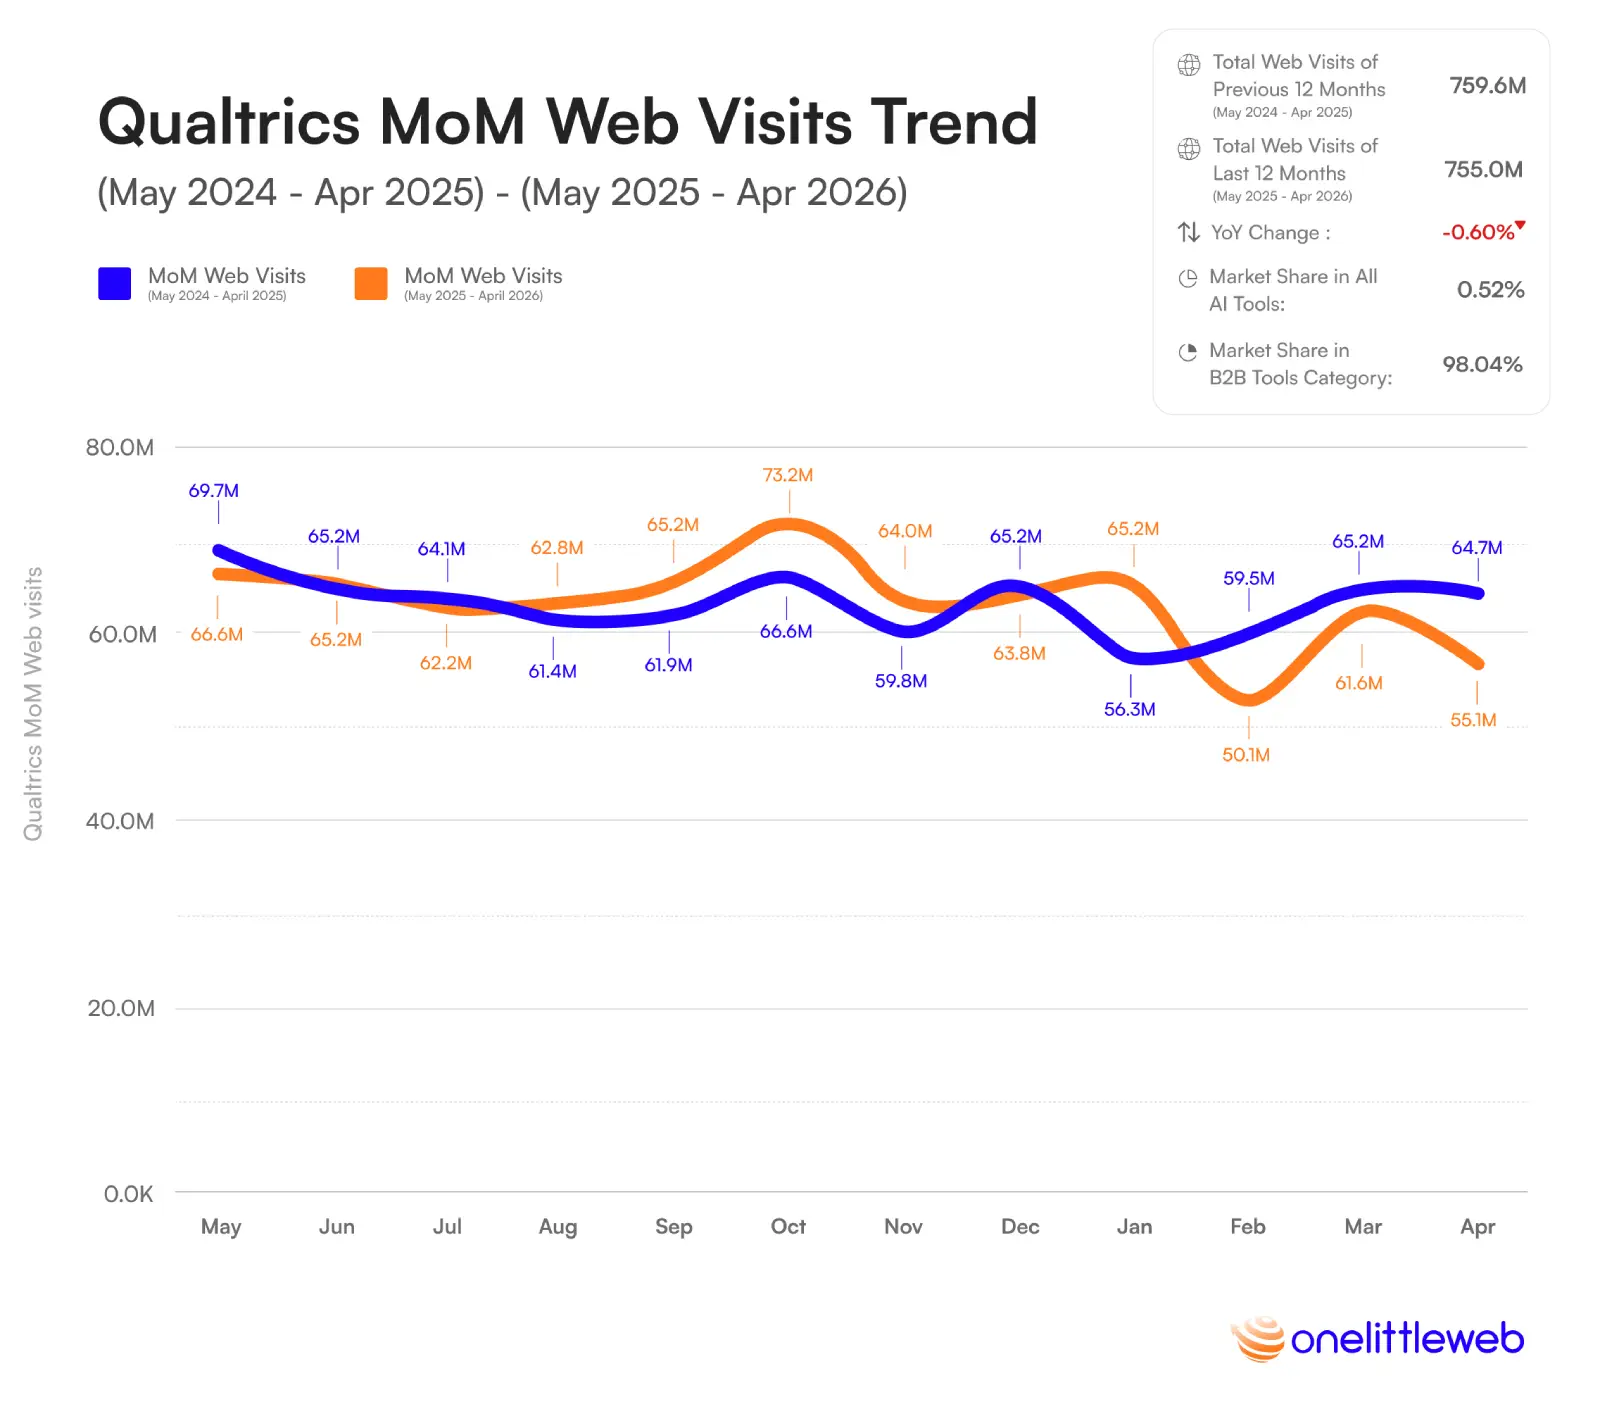
After Quizlet’s steep decline, Qualtrics brings us to the most stable result in the Top 20. It generated 755.0 million web visits from May 2025 to April 2026, only 4.6 million fewer than the 759.6 million visits recorded the year before.
Qualtrics recorded the smallest year-over-year movement of any AI tool in the Top 20. Its annual web visits changed by just 0.60%, while every other tool moved by at least 6%.
The monthly numbers still moved around, ranging from 50.1 million to 73.2 million visits during the latest 12 months. Yet those rises and falls largely balanced each other out, leaving its annual total almost unchanged.
What stood out to us was how little Qualtrics was affected by the wider shifts reshaping the ranking. Chatbots surged, while several student, writing, and translation tools lost ground. Qualtrics did neither. It remained firmly established in B2B use and captured 98.04% of all web visits in its category, making stability its most revealing result.
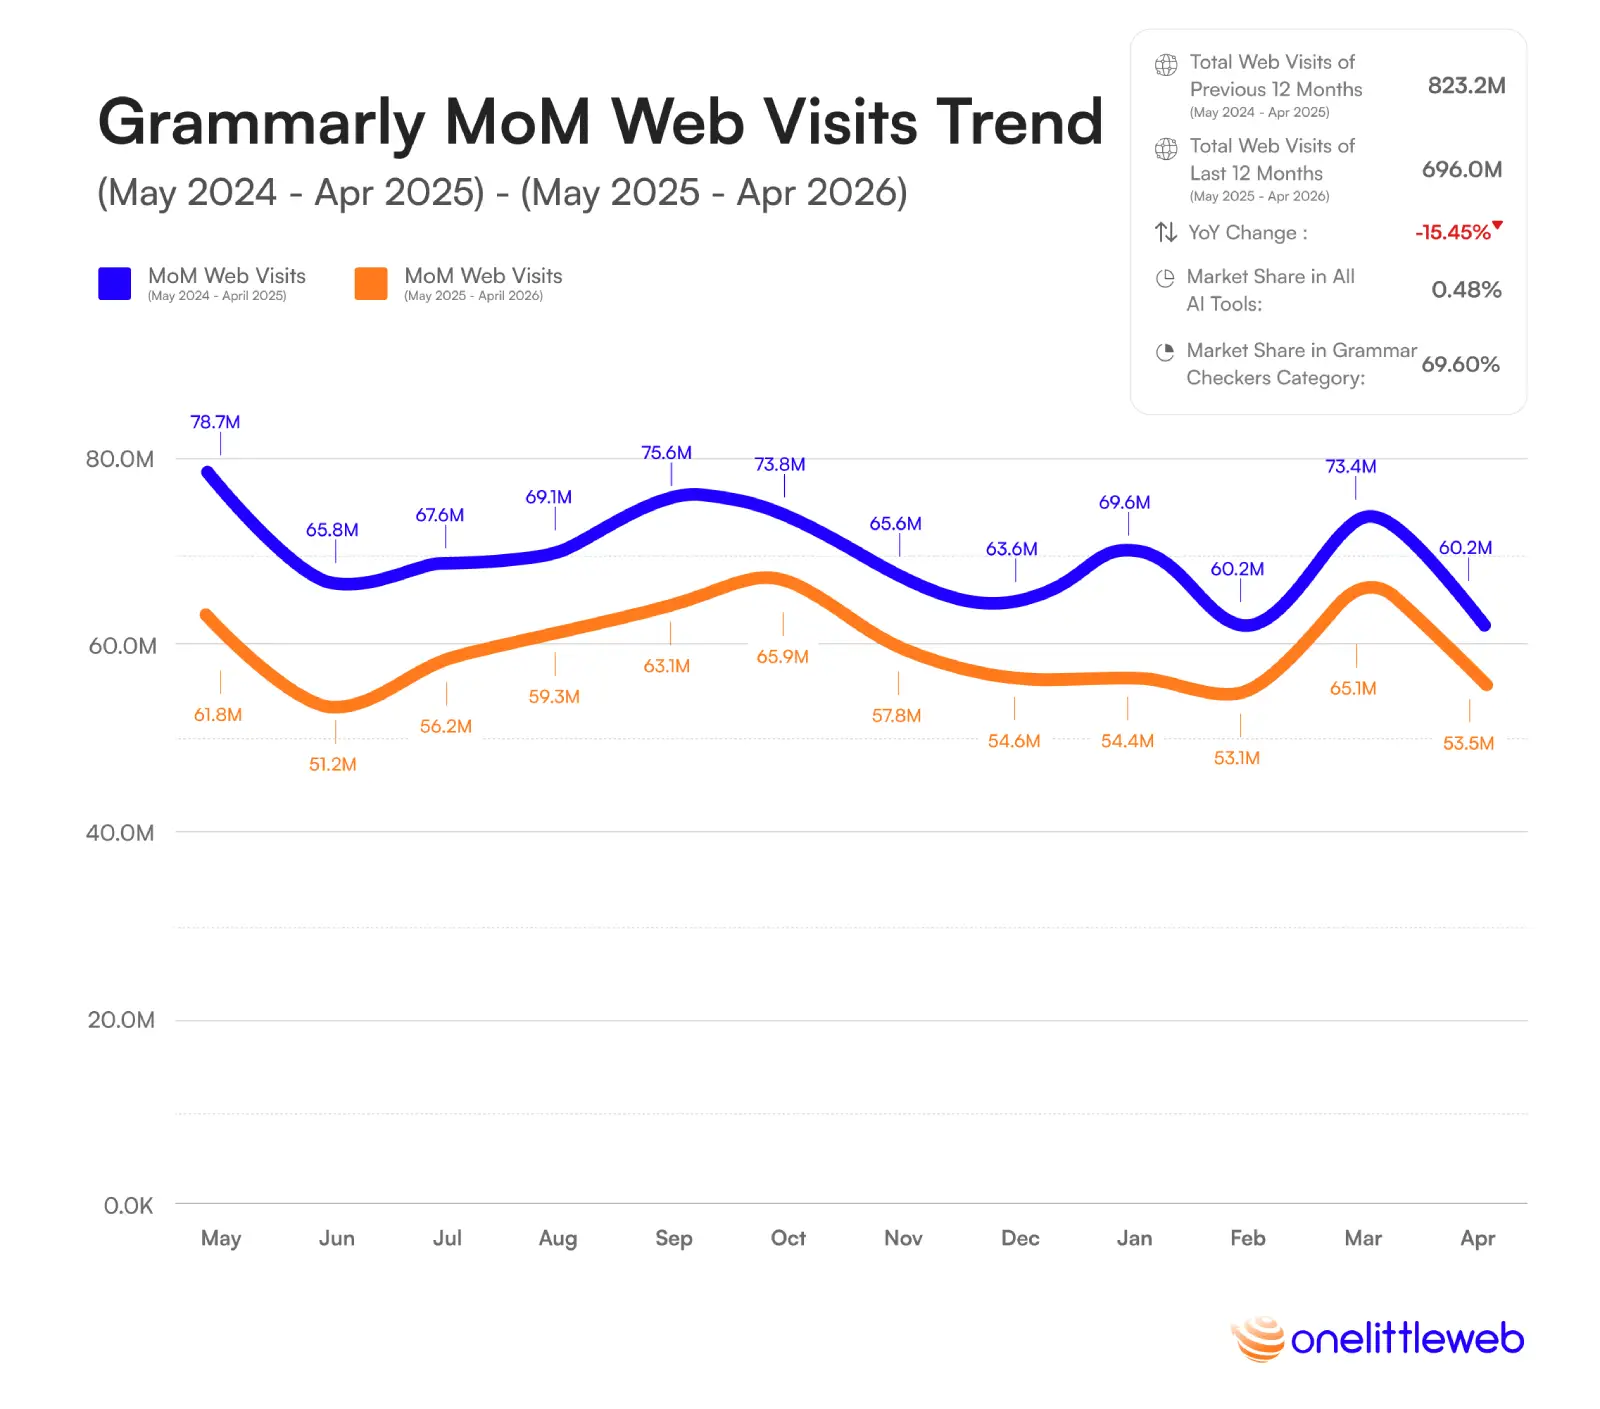
After Qualtrics remained almost unchanged, Grammarly shows a clearer downward shift. The AI tool generated 696.0 million web visits from May 2025 to April 2026, down from 823.2 million the year before. That meant a loss of 127.2 million visits.
Grammarly’s average monthly web visits fell from 68.6 million to 58.0 million, and every month in the latest 12-month period finished below the corresponding month a year earlier.
The monthly trend was not a straight decline, since visits occasionally recovered from one month to the next. Still, the overall level remained consistently lower. Grammarly peaked at 65.9 million visits in October 2025 and reached 65.1 million in March 2026, but neither month matched the stronger levels it regularly recorded during the previous year.
What makes this result more telling is that Grammarly still captured 69.60% of all web visits in the Grammar Checkers category. Its decline does not appear to come from another standalone grammar checker taking control of the category. Instead, it may reflect a broader change in how people access writing assistance, with grammar correction and rewriting now available inside chatbots, document editors, and other general-purpose AI tools.
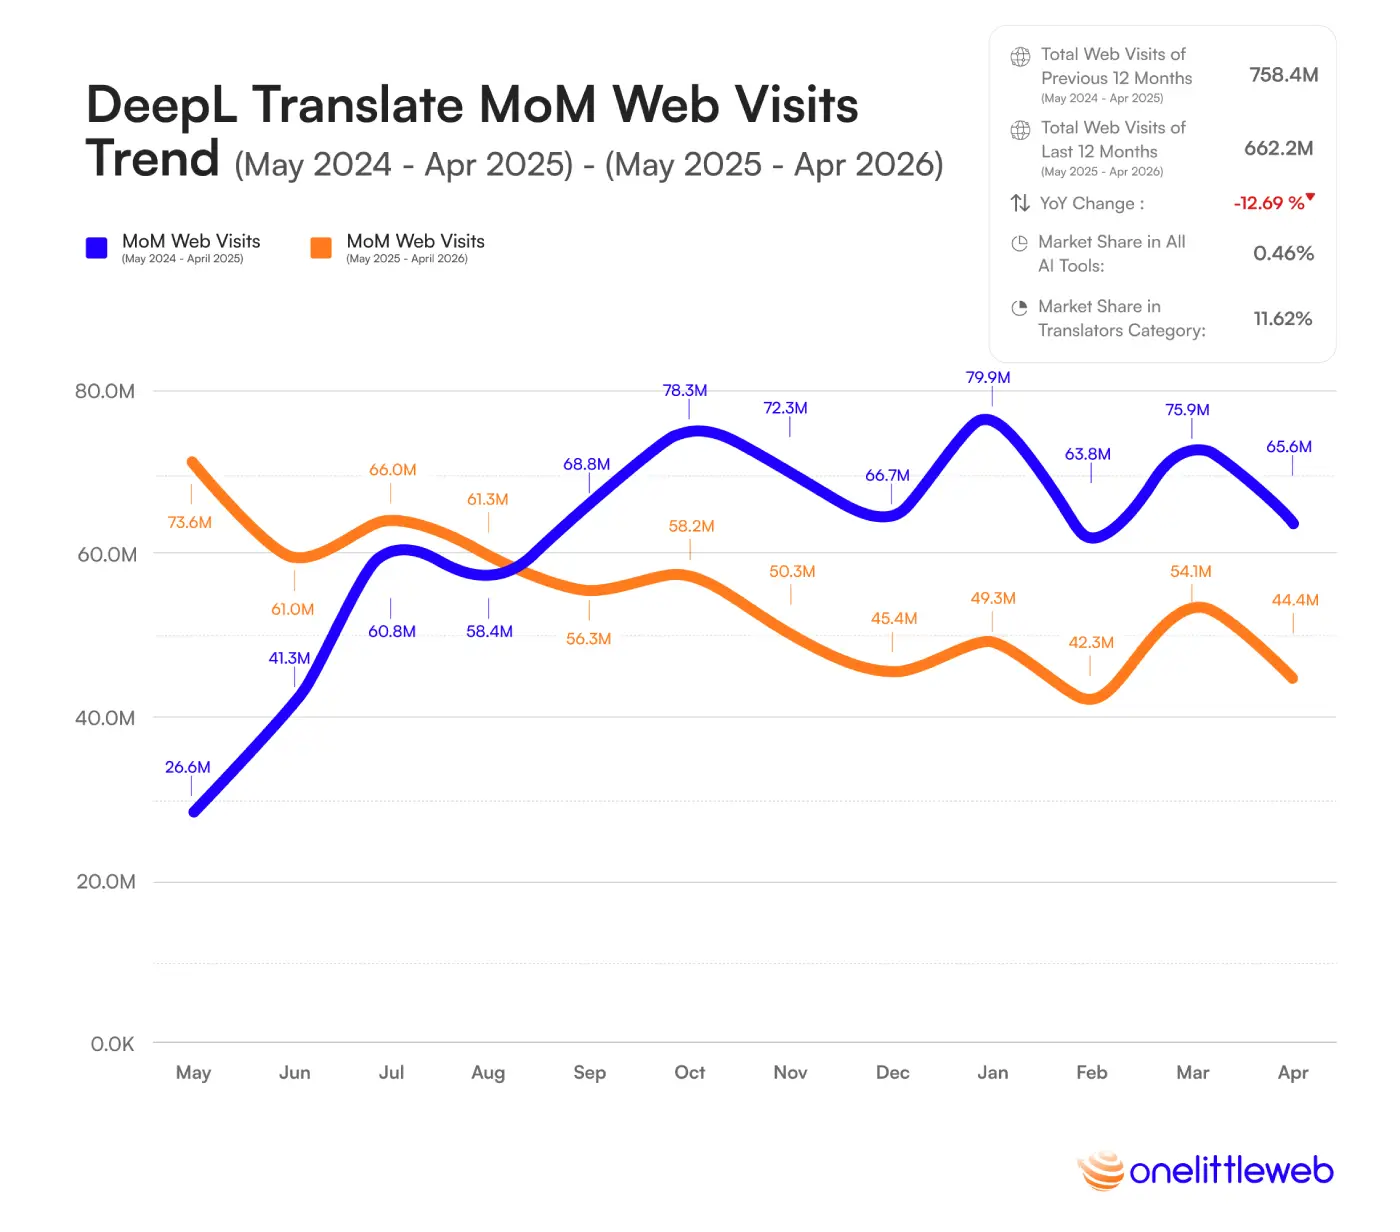
Grammarly’s decline leads us to another established language AI tool moving in the same direction. DeepL generated 662.2 million web visits from May 2025 to April 2026, down from 758.4 million the year before. That meant a loss of 96.2 million visits, or 12.69%.
DeepL generated 376.4 million web visits during the first six months of the latest period, but only 285.8 million in the final six months, a decline of 24.1%.
The full 24-month trend shows why the annual decline does not tell the whole story. DeepL climbed from 26.6 million visits in May 2024 to a peak of 79.9 million in January 2025. From there, the direction gradually reversed. Monthly visits fell below 50 million in four of the final six months and ended at 44.4 million in April 2026, about 44.5% below the peak.
When we compare this with Google Translate, the pattern becomes harder to ignore. Both of the largest translation AI tools lost web visits, suggesting the pressure extends beyond one company. Standalone translators still attract a large audience, but more translation tasks may now be happening inside broader AI tools that can translate, rewrite, explain, and answer follow-up questions in the same conversation.
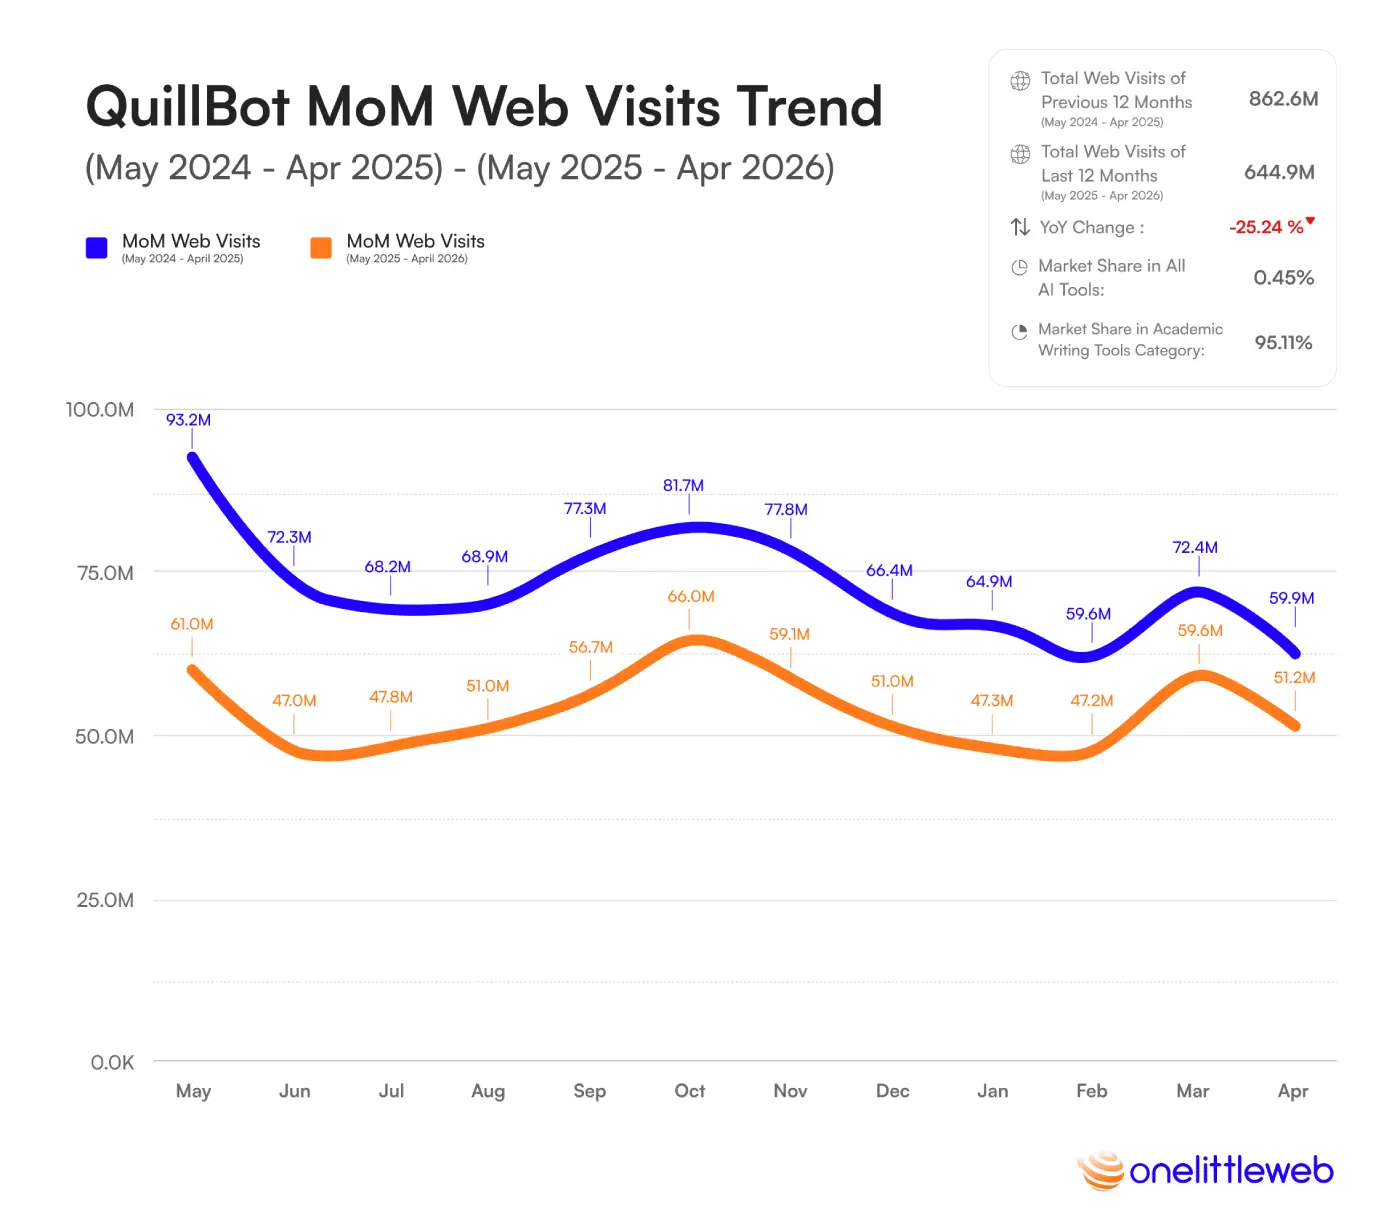
DeepL showed how standalone translation tools are coming under pressure. QuillBot closes our Top 20 with a similar pattern in academic writing. It generated 644.9 million web visits from May 2025 to April 2026, down from 862.6 million the year before.
QuillBot recorded the third-largest absolute decline among the Top 20 AI tools, losing 217.7 million web visits. It also attracted fewer visits in every month of the latest 12-month period than in the corresponding month a year earlier.
The decline was steady rather than sudden. QuillBot began the full 24-month period with 93.2 million web visits in May 2024 and ended with 51.2 million in April 2026, a drop of roughly 45% between those two months. Even its strongest month in the latest period, 66.0 million visits in October 2025, remained below the 81.7 million recorded in October 2024.
What stands out to us is that QuillBot still controlled 95.11% of all web visits in the Academic Writing Tools category. Another specialized academic writing tool did not take its place. Instead, the entire use case may be shifting as ChatGPT, Claude, Gemini, and other general-purpose AI tools now handle paraphrasing, rewriting, summarization, and follow-up questions in the same conversation.
The Top 20 ranking showed us which individual AI tools attracted the most web visits. But when we step back and group those tools by category, a different picture begins to emerge.
Some categories are growing because one dominant AI tool is pulling the entire group forward. Others are expanding across several competitors at once. A few remain large but are losing web visits as users shift toward broader AI tools that can handle several tasks in one place.
The visual below compares the 10 largest AI tool categories by their total web visits from May 2025 to April 2026. It gives us a quick view of the market’s structure and makes the gap between chatbots and every other category much easier to see.
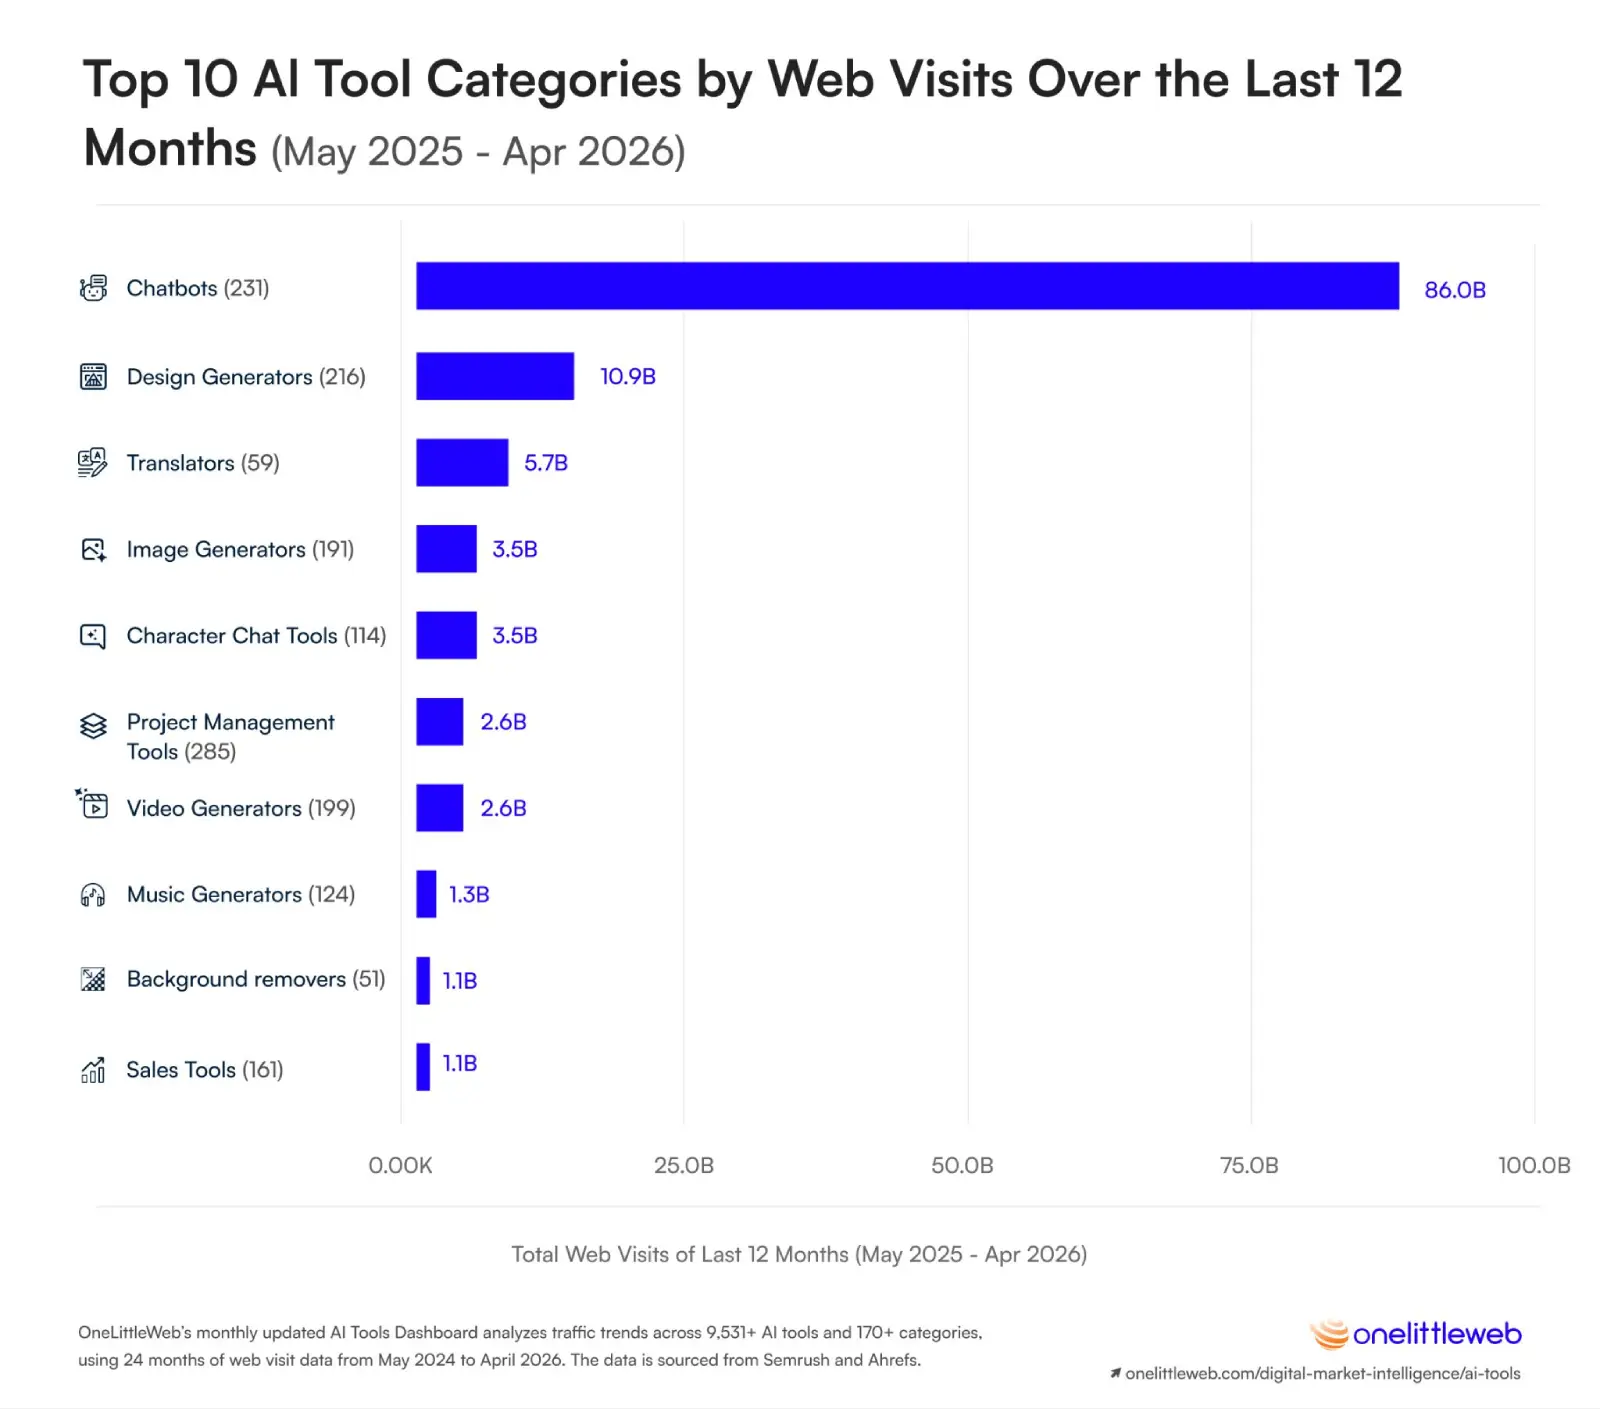
When we compare the categories side by side, the imbalance is impossible to miss. Chatbots generated 86.0 billion web visits, grew 90.82% year over year, and captured a 59.49% market share of all AI tool web visits. In fact, chatbots attracted more than 2.6 times as many web visits as the other nine categories in the Top 10 combined.
The gap after chatbots is enormous. Design Generators ranked second with 10.9 billion web visits, followed by Translators at 5.7 billion. Yet the two categories moved in opposite directions. Design Generators grew 12.87%, while Translators lost 1.6 billion visits, a decline of 22.52%.
That contrast helps us understand how AI use is changing. Design features are increasingly becoming part of tools people already use for presentations, images, and creative work. Translation is moving in the other direction, with the same task now available inside chatbots, browsers, document editors, and other AI tools. People may still be translating just as often, but fewer of those actions require a visit to a standalone translator.
Beyond the largest categories, we found several quieter shifts. Video Generators recorded the strongest growth outside chatbots, rising 31.24% to 2.6 billion web visits, while Music Generators grew 21.22% to 1.3 billion. Image Generators, however, remained almost unchanged at 3.5 billion visits, growing by just 0.19%.
Project Management Tools tell another interesting story. We tracked 285 AI tools in the category, more than in any other category in the Top 10, yet together they generated only 2.6 billion web visits. That points to a broad but fragmented market, where visits are spread across many competing AI tools rather than concentrated around one clear leader.
Character Chat Tools show the opposite pattern. The category generated 3.5 billion web visits, but most of those visits went to Character AI and JanitorAI. So while Project Management Tools are divided across many competitors, Character Chat Tools are largely shaped by two.
Background Removers and Sales Tools both moved backward, declining 5.13% and 9.15%, respectively. In each case, one dominant AI tool accounted for most of the category’s web visits, which meant a decline at the top pulled down the category as a whole.
Taken together, these results show why category totals need context. A category may grow because several AI tools are gaining web visits, or because one leader is carrying nearly all of the increase. Another may look stable overall while major changes are happening beneath the surface.
Before we move inside each category, the full table below brings all of those figures together. It ranks the 10 most-visited AI tool categories by total web visits from May 2025 to April 2026 and includes the number of AI tools tracked, previous and current 12-month totals, absolute change, year-over-year growth, and market share.
(may 2025 - apr 2026)
| Rank | Category | Number of Tools | Total Web Visits of 12 Months (may 2024–apr 2025) | Total Web Visits of Last 12 Months (may 2025–apr 2026) | Change | Change (%) | Market Share (%) |
|---|---|---|---|---|---|---|---|
| 1 | Chatbots | 231 | 45.1B | 86.0B | 40.9B | 90.82% | 59.49% |
| 2 | Design Generators | 216 | 9.6B | 10.9B | 1.2B | 12.87% | 7.52% |
| 3 | Translators | 59 | 7.3B | 5.7B | -1.6B | -22.52% | 3.92% |
| 4 | Image Generators | 191 | 3.5B | 3.5B | 6.7M | 0.19% | 2.44% |
| 5 | Character Chat Tools | 114 | 3.1B | 3.5B | 410.2M | 13.20% | 2.43% |
| 6 | Project Management Tools | 285 | 2.2B | 2.6B | 402.1M | 18.55% | 1.78% |
| 7 | Video Generators | 199 | 2.0B | 2.6B | 609.6M | 31.24% | 1.77% |
| 8 | Music Generators | 124 | 1.0B | 1.3B | 222.7M | 21.22% | 0.88% |
| 9 | Background Removers | 51 | 1.2B | 1.1B | -60.8M | -5.13% | 0.78% |
| 10 | Sales Tools | 161 | 1.2B | 1.1B | -108.1M | -9.15% | 0.74% |
We have already seen that chatbots account for more than half of all AI tool web visits. But when we look inside the category, the concentration becomes even clearer.
The visual below ranks the 10 most-visited chatbots by their total web visits from May 2025 to April 2026. We also compare each AI tool with the previous 12-month period, so you can see which chatbots are expanding, which are beginning to slow down, and how much of the category each one controls.
Together, these 10 chatbots generated roughly 85.6 billion of the category’s 86.0 billion web visits. That means almost every visit in the chatbot category went to the same 10 AI tools.
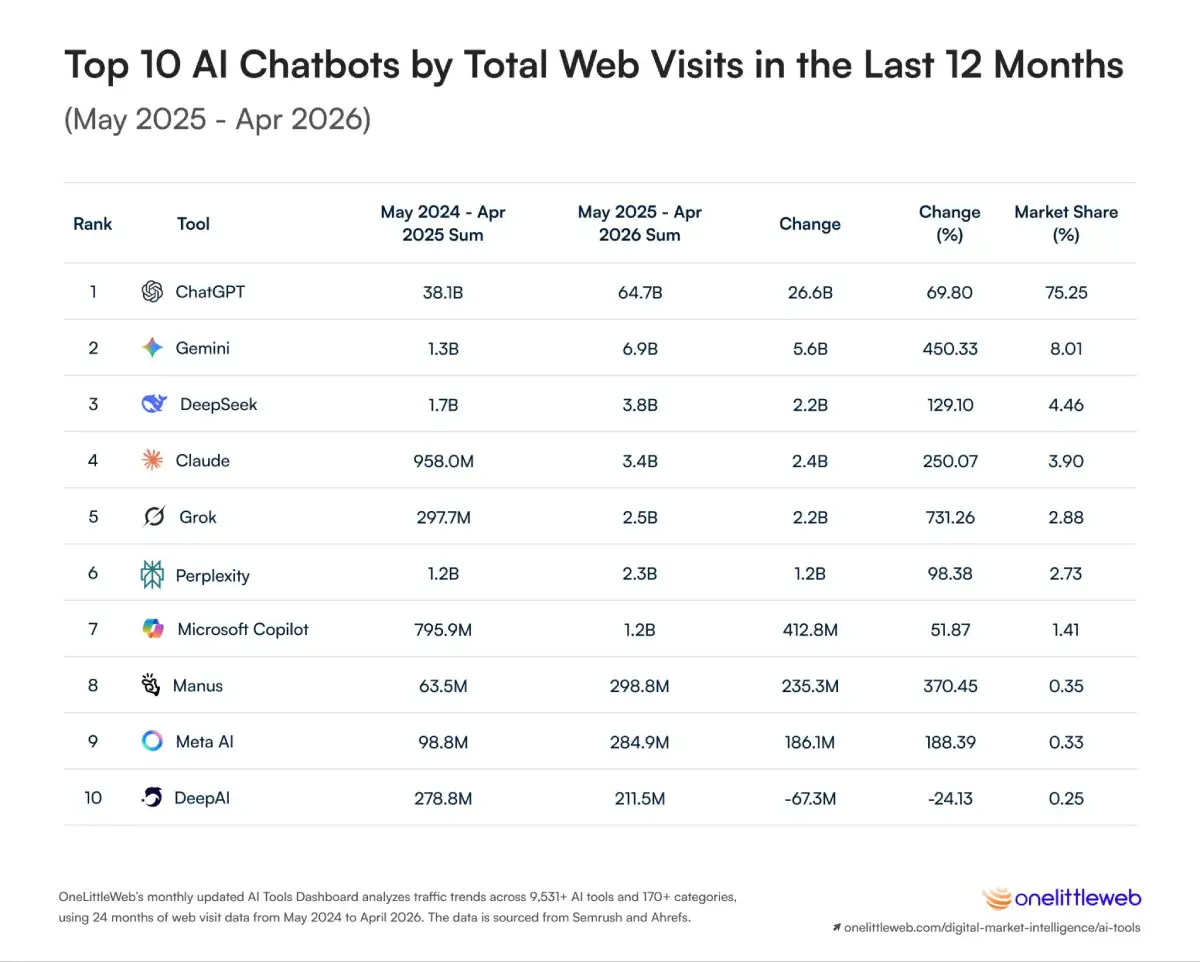
ChatGPT remains the center of the category. It generated 64.7 billion web visits, more than the other nine chatbots in the Top 10 combined, which attracted roughly 20.9 billion.
But the category’s growth did not come from ChatGPT alone. Gemini added 5.6 billion web visits, Claude added 2.4 billion, and Grok added 2.2 billion. Manus grew 370.45%, moving ahead of longer-established AI tools such as DeepAI.
Nine of the 10 largest chatbots gained web visits year over year. DeepAI was the only one to decline, falling 24.13%.
What this tells us is that the chatbot category is not growing around one leader alone. ChatGPT still controls most of the market, but several challengers are expanding at the same time. That makes chatbots both the largest and one of the most competitive categories in the AI tools market.
The full table below brings those differences together, showing how each of the Top 10 chatbots performed across total web visits, year-over-year change, and category market share.
(may 2025 - apr 2026)
| Rank | Tool Name | URL | Category | may 2024 - apr 2025 Sum | may 2025–apr 2026 Sum | Change | Change (%) | Market Share (%) |
|---|---|---|---|---|---|---|---|---|
| 1 | ChatGPT | https://chatgpt.com/ | Chatbots | 38.1B | 64.7B | 26.6B | 69.80% | 75.25% |
| 2 | Gemini | https://gemini.google.com | Chatbots | 1.3B | 6.9B | 5.6B | 450.33% | 8.01% |
| 3 | DeepSeek | https://www.deepseek.com/ | Chatbots | 1.7B | 3.8B | 2.2B | 129.10% | 4.46% |
| 4 | Claude | https://claude.ai | Chatbots | 958.0M | 3.4B | 2.4B | 250.07% | 3.90% |
| 5 | Grok | https://grok.com/ | Chatbots | 297.7M | 2.5B | 2.2B | 731.26% | 2.88% |
| 6 | Perplexity | https://www.perplexity.ai/ | Chatbots | 1.2B | 2.3B | 1.2B | 98.38% | 2.73% |
| 7 | Microsoft Copilot | https://copilot.microsoft.com/ | Chatbots | 795.9M | 1.2B | 412.8M | 51.87% | 1.41% |
| 8 | Manus | https://manus.im/ | Chatbots | 63.5M | 298.8M | 235.3M | 370.45% | 0.35% |
| 9 | Meta AI | https://www.meta.ai/ | Chatbots | 98.8M | 284.9M | 186.1M | 188.39% | 0.33% |
| 10 | DeepAI | https://deepai.org/ | Chatbots | 278.8M | 211.5M | -67.3M | -24.13% | 0.25% |
If the chatbot category is concentrated around a small group of leaders, Design Generators take that concentration much further. As we move into the second-largest AI tool category, one name accounts for almost everything.
The visual below ranks the 10 most-visited AI Design Generators by their total web visits from May 2025 to April 2026. We compare those results with the previous 12 months to show how much of the category belongs to Canva, which smaller AI tools are still growing, and which ones are losing ground.
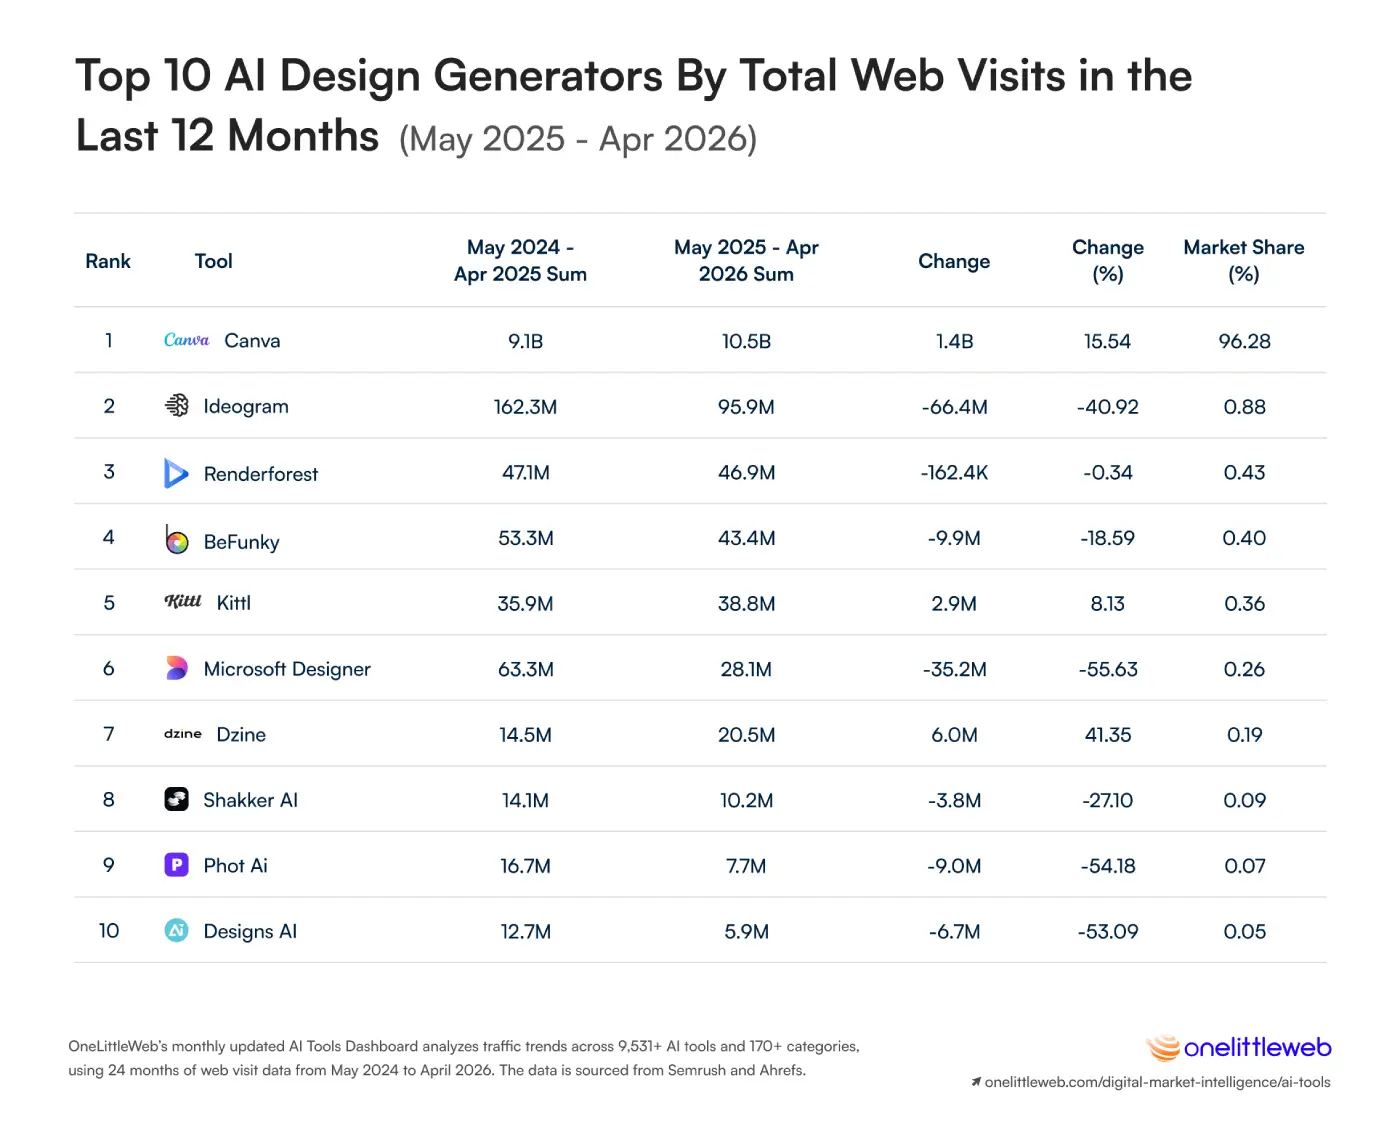
Canva generated 10.5 billion web visits and captured 96.28% of all web visits in the Design Generators category. The other nine AI tools in the Top 10 generated only about 297.4 million visits combined.
Canva attracted more than 35 times as many web visits as the other nine Design Generators in the Top 10 combined.
That leaves very little room for a close second. Ideogram ranked next with 95.9 million web visits, but its visits fell 40.92% year over year. Renderforest and BeFunky followed with 46.9 million and 43.4 million visits, while both remained flat or declined.
Only three AI tools in the Top 10 increased their web visits: Canva grew 15.54%, Dzine grew 41.35%, and Kittl grew 8.13%. Microsoft Designer, Phot AI, and Designs AI each lost more than half of their previous-year web visits.
What this tells us is that the category is large, but not broadly competitive at the top. Canva is not simply a leading Design Generator. It has become the category’s default AI tool, while the rest compete for a very small share of the remaining web visits.
The full table below shows how wide that gap has become, comparing the Top 10 Design Generators by total web visits, year-over-year change, and category market share.
(may 2025 - apr 2026)
| Rank | Tool Name | URL | Category | may 2024–apr 2025 Sum | may 2025–apr 2026 Sum | Change | Change (%) | Market Share (%) |
|---|---|---|---|---|---|---|---|---|
| 1 | Canva | https://www.canva.com/ | Design Generators | 9.1B | 10.5B | 1.4B | 15.54% | 96.61% |
| 2 | Ideogram | https://ideogram.ai/ | Design Generators | 162.3M | 95.9M | -66.4M | -40.92% | 0.88% |
| 3 | Renderforest | https://www.renderforest.com/ | Design Generators | 47.1M | 46.9M | -162.4K | -0.34% | 0.43% |
| 4 | BeFunky | https://www.befunky.com/ | Design Generators | 53.3M | 43.4M | -9.9M | -18.59% | 0.40% |
| 5 | Kittl | https://www.kittl.com/ | Design Generators | 35.9M | 38.8M | 2.9M | 8.13% | 0.36% |
| 6 | Microsoft Designer | https://designer.microsoft.com/ | Design Generators | 63.3M | 28.1M | -35.2M | -55.63% | 0.26% |
| 7 | Dzine | https://www.dzine.ai/ | Design Generators | 14.5M | 20.5M | 6.0M | 41.35% | 0.19% |
| 8 | Shakker AI | https://www.shakker.ai/ | Design Generators | 14.1M | 10.2M | -3.8M | -27.10% | 0.09% |
| 9 | Phot AI | https://www.phot.ai/ | Design Generators | 16.7M | 7.7M | -9.0M | -54.18% | 0.07% |
| 10 | Designs AI | https://designs.ai/ | Design Generators | 12.7M | 5.9M | -6.7M | -53.09% | 0.05% |
Canva showed us what category dominance looks like when the leading AI tool is still growing. Translators reveal the other side of that story. This category is even more concentrated, but web visits are moving in the wrong direction.
The visual below ranks the 10 most-visited AI translators from May 2025 to April 2026 and compares their performance with the previous 12 months. Together, these AI tools show whether the category is losing web visits because one major tool is struggling or because demand for standalone translation tools is declining more broadly.
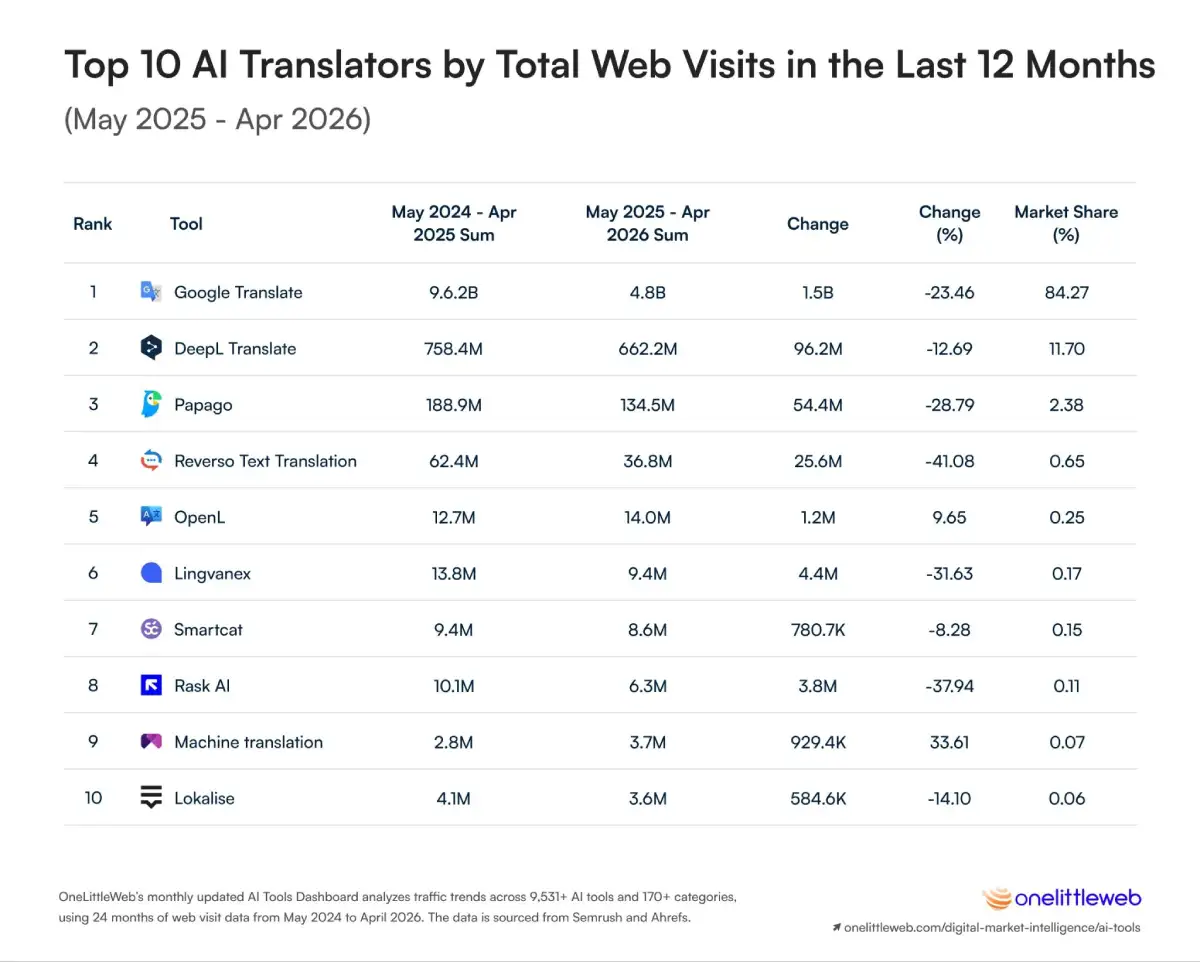
Google Translate remained far ahead with 4.8 billion web visits and an 84.27% category market share. DeepL followed with 662.2 million visits and an 11.70% share, meaning the two largest AI tools captured nearly 96% of all web visits in the category. Yet both declined, with Google Translate losing 1.46 billion visits and DeepL losing 96.2 million.
Eight of the 10 largest AI translators lost web visits. The only two that grew, OpenL and MachineTranslation.com, added roughly 2.1 million visits combined, while Google Translate alone lost 1.46 billion.
The pattern continues across the rest of the ranking. Papago declined 28.79%, Reverso fell 41.08%, Lingvanex lost 31.63%, and Rask AI dropped 37.94%. Overall, the Translators category lost 1.6 billion web visits, down 22.52% year over year.
What we see here is not one AI tool losing ground to a stronger translator. Almost the entire category is shrinking at once. Translation has not become less useful, but users can now translate, rewrite, summarize, and ask follow-up questions inside broader AI tools such as ChatGPT, Gemini, and Claude. That may be reducing the need to visit a separate AI tool for translation alone.
The full table below shows how widespread that decline has become, comparing the top 10 translators by total web visits, year-over-year change, and category market share.
(may 2025 - apr 2026)
| Rank | Tool Name | URL | Category | may 2024–apr 2025 Sum | may 2025–apr 2026 Sum | Change | Change (%) | Market Share (%) |
|---|---|---|---|---|---|---|---|---|
| 1 | Google Translate | https://translate.google.com | Translators | 6.2B | 4.8B | -1.5B | -23.46% | 84.27% |
| 2 | DeepL Translate | https://www.deepl.com/en/translator | Translators | 758.4M | 662.2M | -96.2M | -12.69% | 11.70% |
| 3 | Papago | https://papago.naver.com/ | Translators | 188.9M | 134.5M | -54.4M | -28.79% | 2.38% |
| 4 | Reverso Text Translation | https://www.reverso.net/text-translation | Translators | 62.4M | 36.8M | -25.6M | -41.08% | 0.65% |
| 5 | OpenL | https://openl.io/ | Translators | 12.7M | 14.0M | 1.2M | 9.65% | 0.25% |
| 6 | Lingvanex | https://lingvanex.com/ | Translators | 13.8M | 9.4M | -4.4M | -31.63% | 0.17% |
| 7 | Smartcat | https://www.smartcat.com/ | Translators | 9.4M | 8.6M | -780.7K | -8.28% | 0.15% |
| 8 | Rask AI | https://www.rask.ai/ | Translators | 10.1M | 6.3M | -3.8M | -37.94% | 0.11% |
| 9 | Machinetranslation | https://www.machinetranslation.com/ | Translators | 2.8M | 3.7M | 929.4K | 33.61% | 0.07% |
| 10 | Lokalise | https://lokalise.com/ | Translators | 4.1M | 3.6M | -584.6K | -14.10% | 0.06% |
After seeing web visits fall across most translators, image generators give us a much more competitive picture. The category did not produce one clear growth story. Some of its largest AI tools lost web visits, while several smaller challengers expanded quickly enough to reshape the ranking.
The visual below ranks the 10 most-visited AI image generators from May 2025 to April 2026 and compares their performance with the previous 12 months. This helps us see whether growth is staying with the established names or moving toward newer alternatives.
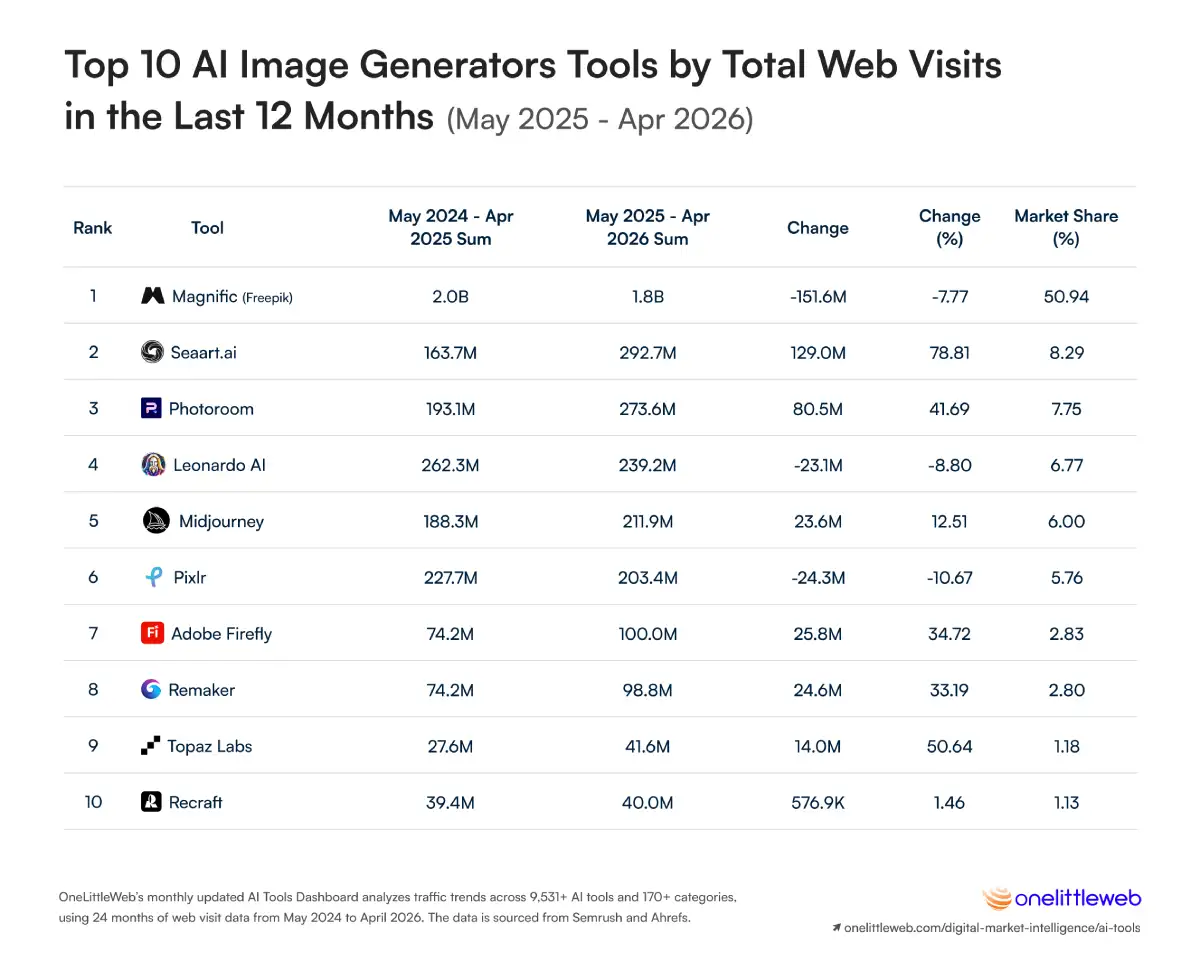
Magnific (formerly FreePik) remained the category leader with 1.8 billion web visits and a 50.94% market share, but its annual web visits declined by 151.6 million, or 7.77%. Unlike Canva’s near-total control of Design Generators, Magnific (formerly FreePik) faces several AI tools attracting meaningful audiences of their own.
Seven of the Top 10 image generators gained web visits. SeaArt.ai and Photoroom added 209.5 million visits combined, while Magnific (formerly FreePik) lost 151.6 million, showing that new demand is increasingly flowing toward its challengers.
SeaArt.ai recorded the fastest growth among the largest AI tools in the category, rising 78.81% to 292.7 million web visits. Photoroom followed with 273.6 million visits, up 41.69%, while Adobe Firefly, Remaker, Topaz Labs, and Midjourney all finished above their previous-year totals.
At the same time, Leonardo AI fell 8.80%, and Pixlr declined 10.67%. This gives us a category where growth is real, but uneven. Users are not settling around one obvious winner beyond Magnific (formerly FreePik). They are spreading their web visits across AI tools built for different styles, workflows, and levels of creative control.
In human terms, image generation still looks like an open market. Magnific (Freepik) remains the leader, but it is not widening its lead. Several challengers are gaining web visits at the same time, suggesting that users are still testing different tools and the category has not yet settled around one clear long-term winner.
The full table below shows how that competition is developing, comparing the Top 10 image generators by total web visits, year-over-year change, and category market share.
(may 2025 - apr 2026)
| Rank | Tool Name | URL | Category | may 2024–apr 2025 Sum | may 2025–apr 2026 Sum | Change | Change (%) | Market Share (%) |
|---|---|---|---|---|---|---|---|---|
| 1 | Magnific (Freepik) | https://www.magnific.com/ | Image Generators | 2.0B | 1.8B | -151.6M | -7.77% | 50.94% |
| 2 | Seaart.ai | https://seaart.ai/ | Image Generators | 163.7M | 292.7M | 129.0M | 78.81% | 8.29% |
| 3 | Photoroom | https://www.photoroom.com/ | Image Generators | 193.1M | 273.6M | 80.5M | 41.69% | 7.75% |
| 4 | Leonardo AI | https://leonardo.ai/ | Image Generators | 262.3M | 239.2M | -23.1M | -8.80% | 6.77% |
| 5 | Midjourney | https://www.midjourney.com/ | Image Generators | 188.3M | 211.9M | 23.6M | 12.51% | 6.00% |
| 6 | Pixlr | https://pixlr.com/ | Image Generators | 227.7M | 203.4M | -24.3M | -10.67% | 5.76% |
| 7 | Adobe Firefly | https://firefly.adobe.com/ | Image Generators | 74.2M | 100.0M | 25.8M | 34.72% | 2.83% |
| 8 | Remaker | https://remaker.ai/ | Image Generators | 74.2M | 98.8M | 24.6M | 33.19% | 2.80% |
| 9 | Topaz Labs | https://www.topazlabs.com/ | Image Generators | 27.6M | 41.6M | 14.0M | 50.64% | 1.18% |
| 10 | Recraft | https://recraft.ai/ | Image Generators | 39.4M | 40.0M | 576.9K | 1.46% | 1.13% |
Image generators showed us a category where web visits are spread across several competing AI tools. Character chat tools look very different. Here, almost the entire category is concentrated around just two names.
The visual below ranks the 10 most-visited Character Chat Tools from May 2025 to April 2026 and compares them with the previous 12 months. The category grew from 3.1 billion to 3.5 billion web visits, an increase of 13.20%, but that growth was far less broad than the total suggests.
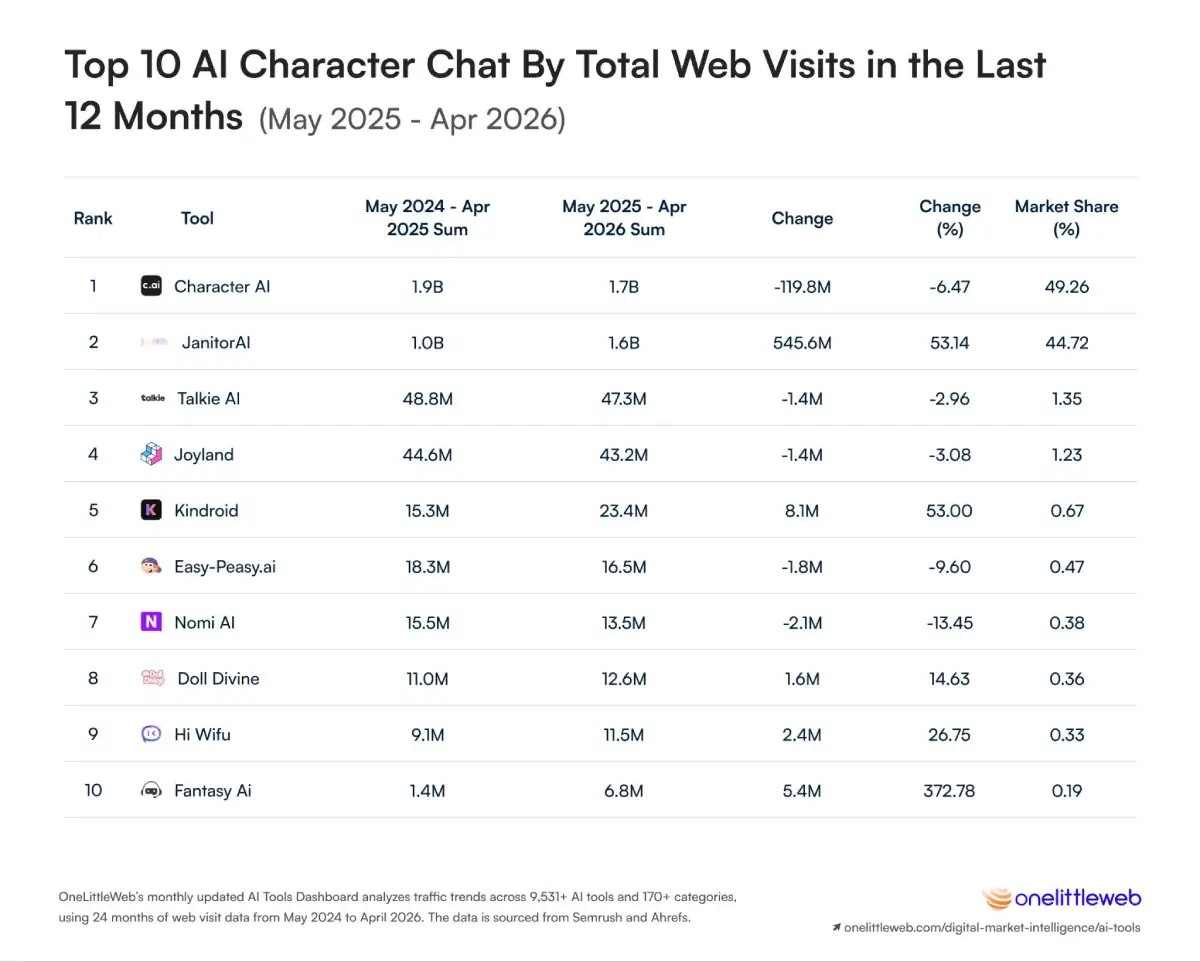
Character AI remained the largest AI tool in the category with 1.7 billion web visits, but its total fell 6.47%. JanitorAI moved in the opposite direction, growing 53.14% to reach 1.6 billion visits. Together, the two AI tools captured 93.98% of all category web visits, leaving the other eight tools to compete for just over 6%.
JanitorAI added 545.6 million web visits, more than the category’s entire net gain of 410.2 million. Without JanitorAI, Character Chat Tools would have lost roughly 135.4 million visits year over year.
That changes how we should read the category’s growth. Character Chat Tools did not expand because most of the leading AI tools gained users at the same time. In fact, Character AI, Talkie AI, Joyland, Easy-Peasy.ai, and Nomi AI all lost web visits. Most of the category’s progress came from one challenger moving rapidly toward the leader.
Further down the ranking, Fantasy AI posted the fastest percentage growth at 372.78%, but its total reached only 6.8 million visits. This is a useful reminder that rapid growth from a small base can signal early momentum, but it does not yet change the balance of the category.
In practical terms, character chat tools are becoming more competitive at the top, not more evenly distributed across the category. Character AI still leads, but JanitorAI has narrowed what was once a wide gap and turned the category into a much closer two-tool contest.
The full table below shows how that shift is playing out across the Top 10 Character Chat Tools, comparing total web visits, year-over-year change, and category market share.
(may 2025 - apr 2026)
| Rank | Tool Name | URL | Category | may 2024–apr 2025 Sum | may 2025–apr 2026 Sum | Change | Change (%) | Market Share (%) |
|---|---|---|---|---|---|---|---|---|
| 1 | Character AI | https://character.ai/ | Character Chat Tools | 1.9B | 1.7B | -119.8M | -6.47% | 49.26% |
| 2 | JanitorAI | https://janitorai.com/ | Character Chat Tools | 1.0B | 1.6B | 545.6M | 53.14% | 44.72% |
| 3 | Talkie AI | https://www.talkie-ai.com/ | Character Chat Tools | 48.8M | 47.3M | -1.4M | -2.96% | 1.35% |
| 4 | Joyland | https://www.joyland.ai/ | Character Chat Tools | 44.6M | 43.2M | -1.4M | -3.08% | 1.23% |
| 5 | Kindroid | https://kindroid.ai/ | Character Chat Tools | 15.3M | 23.4M | 8.1M | 53.00% | 0.67% |
| 6 | Easy-Peasy.ai | https://easy-peasy.ai/ | Character Chat Tools | 18.3M | 16.5M | -1.8M | -9.60% | 0.47% |
| 7 | Nomi AI | https://nomi.ai/ | Character Chat Tools | 15.5M | 13.5M | -2.1M | -13.45% | 0.38% |
| 8 | Doll Divine | https://www.dolldivine.com/ | Character Chat Tools | 11.0M | 12.6M | 1.6M | 14.63% | 0.36% |
| 9 | Hi Wifu | https://hiwaifu.com/ | Character Chat Tools | 9.1M | 11.5M | 2.4M | 26.75% | 0.33% |
| 10 | Fantasy AI | https://fantasy.ai/ | Character Chat Tools | 1.4M | 6.8M | 5.4M | 372.78% | 0.19% |
Character Chat Tools were concentrated around two clear leaders. Project Management Tools take us into a far more balanced category, where several AI tools are competing within the same range rather than one name controlling most web visits.
The visual below ranks the 10 most-visited AI project management tools from May 2025 to April 2026 and compares them with the previous 12 months. The category grew from 2.2 billion to 2.6 billion web visits, an increase of 18.55%, with the Top 10 accounting for roughly 2.44 billion visits.
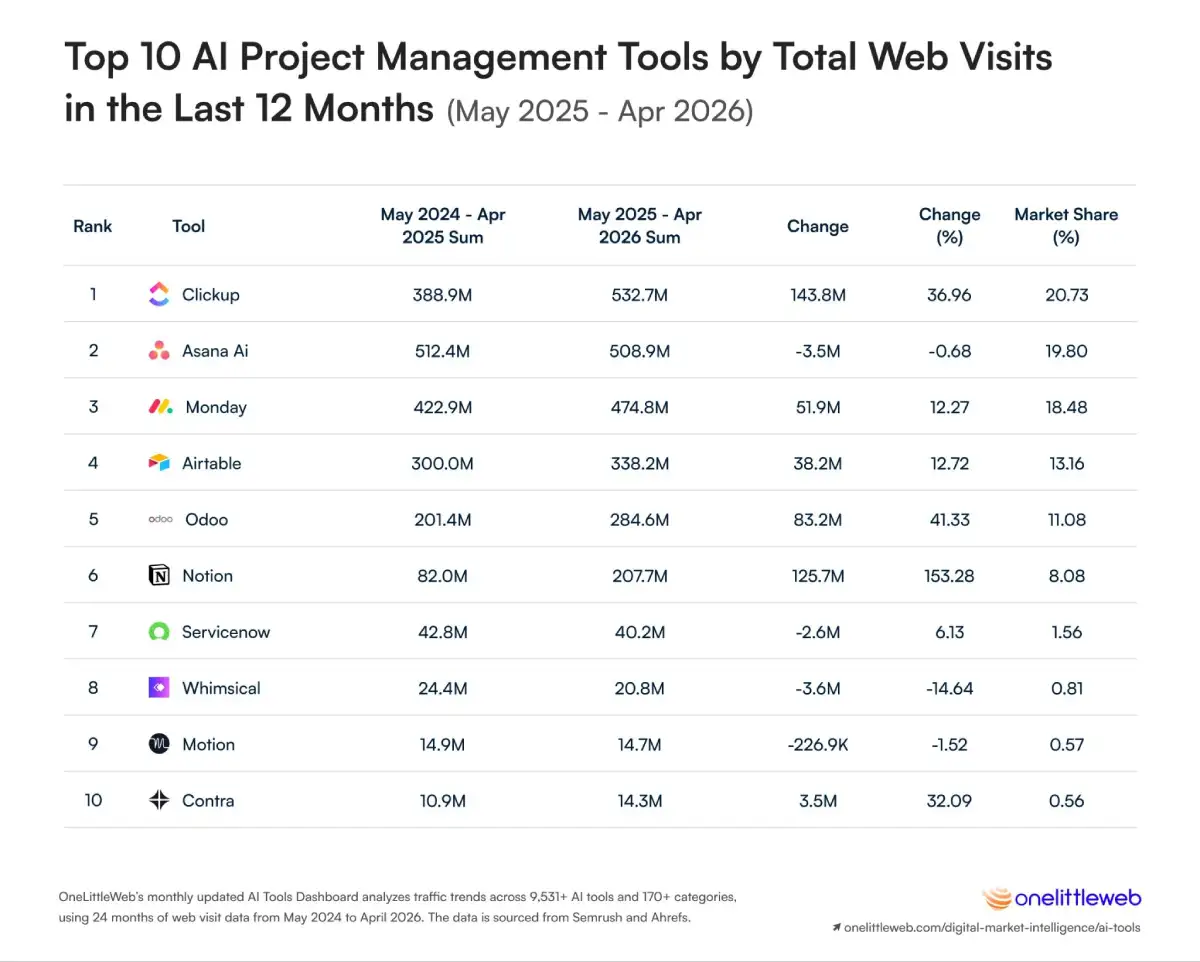
ClickUp moved into first place with 532.7 million web visits, growing 36.96% year over year. Asana AI followed closely with 508.9 million visits, but its total remained almost unchanged, declining by 0.68%. Monday ranked third with 474.8 million visits, while Airtable reached 338.2 million.
Only 57.9 million web visits separated ClickUp, Asana AI, and Monday. Together, the three AI tools generated more than 1.5 billion visits, yet none held even one-quarter of the category.
That gives this category a very different competitive shape from Design Generators, Translators, or Background Removers. Teams are not gathering around one default AI tool. Instead, their web visits are spread across several products that solve overlapping needs, including task management, collaboration, planning, documentation, and workflow automation.
The biggest shift came from Notion. Its web visits rose from 82.0 million to 207.7 million, an increase of 153.28%, making it the fastest-growing AI tool in the Top 10. ClickUp added slightly more visits in absolute terms at 143.8 million, but Notion more than doubled its previous-year total.
In human terms, the data suggests that AI adoption in project management is happening inside tools teams already use to organize their work. Rather than replacing project management software with one new AI product, teams appear to be adopting AI features across several familiar workspaces. That helps explain why the category is growing without producing one runaway leader.
The full table below shows how that competition is spread across the top 10 project management tools, comparing total web visits, year-over-year change, and category market share.
(may 2025 - apr 2026)
| Rank | Tool Name | URL | Category | may 2024–apr 2025 Sum | may 2025–apr 2026 Sum | Change | Change (%) | Market Share (%) |
|---|---|---|---|---|---|---|---|---|
| 1 | Clickup | https://clickup.com/ | Project Management Tools | 388.9M | 532.7M | 143.8M | 36.96% | 20.73% |
| 2 | Asana Ai | https://asana.com/ | Project Management Tools | 512.4M | 508.9M | -3.5M | -0.68% | 19.80% |
| 3 | Monday | https://monday.com/ | Project Management Tools | 422.9M | 474.8M | 51.9M | 12.27% | 18.48% |
| 4 | Airtable | https://airtable.com/ | Project Management Tools | 300.0M | 338.2M | 38.2M | 12.72% | 13.16% |
| 5 | Odoo | https://www.odoo.com/ | Project Management Tools | 201.4M | 284.6M | 83.2M | 41.33% | 11.08% |
| 6 | Notion | https://www.notion.com/ | Project Management Tools | 82.0M | 207.7M | 125.7M | 153.28% | 8.08% |
| 7 | Servicenow | https://www.servicenow.com/ | Project Management Tools | 42.8M | 40.2M | -2.6M | -6.13% | 1.56% |
| 8 | Whimsical | https://whimsical.com/ | Project Management Tools | 24.4M | 20.8M | -3.6M | -14.64% | 0.81% |
| 9 | Motion | https://www.usemotion.com/ | Project Management Tools | 14.9M | 14.7M | -226.9K | -1.52% | 0.57% |
| 10 | Contra | https://contra.com/ | Project Management Tools | 10.9M | 14.3M | 3.5M | 32.09% | 0.56% |
Project Management Tools were evenly divided among several established AI tools. Video Generators take that competition much further. Here, the ranking changed quickly, newer names moved to the top, and no single AI tool came close to controlling the category.
The visual below ranks the 10 most-visited AI video generators from May 2025 to April 2026 and compares them with the previous 12 months. The category grew from 2.0 billion to 2.6 billion web visits, adding 609.6 million visits and increasing 31.24% year over year.
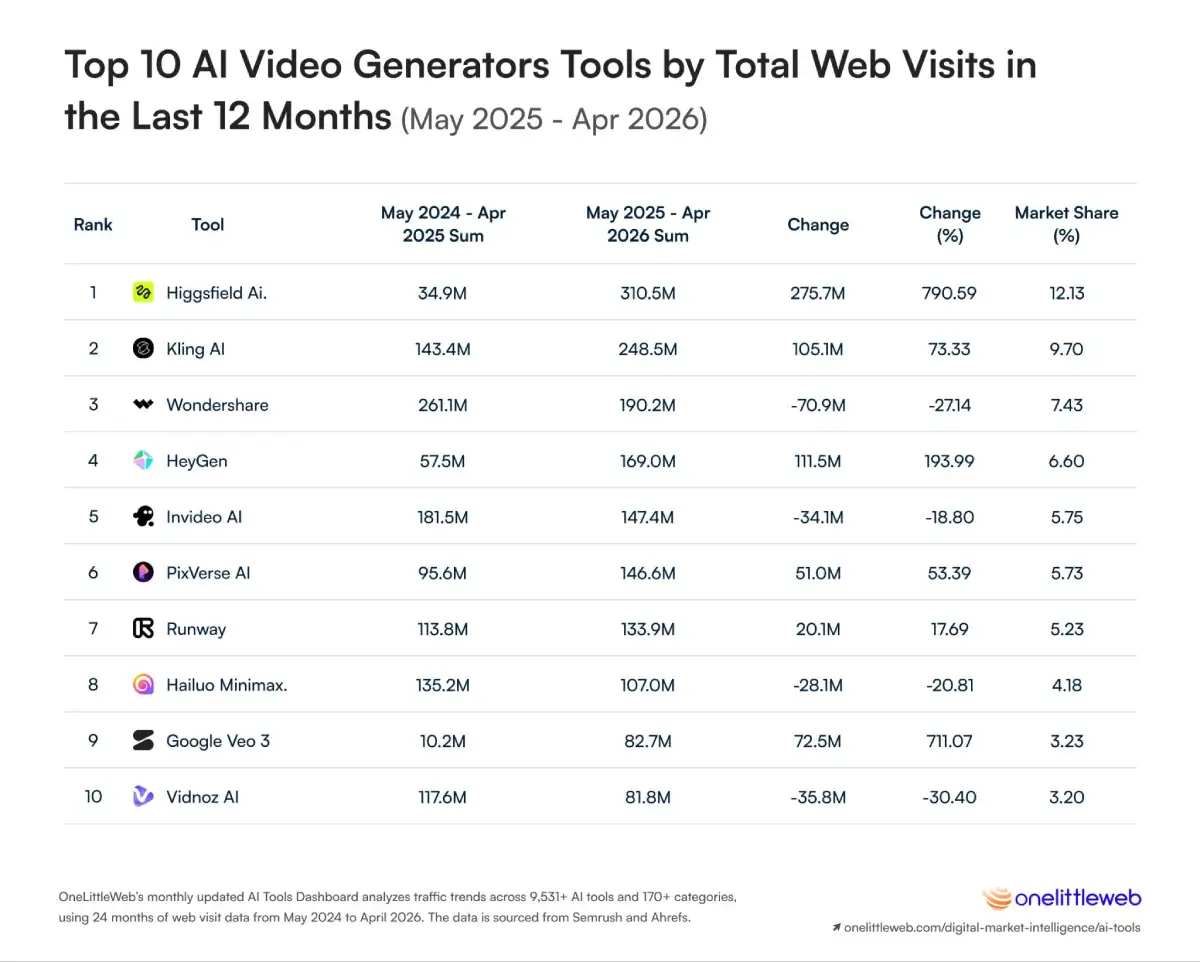
Higgsfield AI moved into first place with 310.5 million web visits, up from just 34.9 million the year before. Its 790.59% growth made it the fastest-growing AI tool in the category. Kling AI ranked second with 248.5 million visits, while Wondershare followed with 190.2 million, despite losing 27.14% of its previous-year visits.
Higgsfield AI added 275.7 million web visits, accounting for roughly 45% of the Video Generators category’s total year-over-year gain. Yet even after reaching first place, it held only 12.13% of category web visits.
That combination tells us a lot about where AI video stands today. The category is growing quickly, but it has not settled around one default AI tool. Higgsfield AI leads, yet nearly 88% of category web visits still go elsewhere. The Top 10 together generated about 1.62 billion visits, leaving a meaningful share spread across the other 189 Video Generators we tracked.
The movement below the top spot was just as sharp. HeyGen nearly tripled its web visits, growing 193.99% to 169.0 million, while Google Veo 3 rose 711.07% to 82.7 million. Kling AI and PixVerse AI gained 73.33% and 53.39%, respectively. At the same time, Wondershare, InVideo AI, Hailuo Minimax, and Vidnoz AI all declined.
In human terms, people are still testing where AI video fits into their work, and no AI tool has yet become the obvious destination. New releases can shift web visits quickly, while an established name can lose ground within a single year. That makes video generators one of the fastest-growing categories in our study but one of the least settled.
The full table below shows how quickly the category is changing, comparing the top 10 video generators by total web visits, year-over-year change, and category market share.
(may 2025 - apr 2026)
| Rank | Tool Name | URL | Category | may 2024–apr 2025 Sum | may 2025–apr 2026 Sum | Change | Change (%) | Market Share (%) |
|---|---|---|---|---|---|---|---|---|
| 1 | Higgsfield AI | https://higgsfield.ai/ | Video Generators | 34.9M | 310.5M | 275.7M | 790.59% | 12.13% |
| 2 | Kling AI | https://klingai.com/global/?ref=aitools&utm_source=aitools&utm_medium=referral | Video Generators | 143.4M | 248.5M | 105.1M | 73.33% | 9.70% |
| 3 | Wondershare | https://www.wondershare.com/ | Video Generators | 261.1M | 190.2M | -70.9M | -27.14% | 7.43% |
| 4 | HeyGen | https://www.heygen.com/ | Video Generators | 57.5M | 169.0M | 111.5M | 193.99% | 6.60% |
| 5 | Invideo AI | https://invideo.io/ | Video Generators | 181.5M | 147.4M | -34.1M | -18.80% | 5.75% |
| 6 | PixVerse AI | https://pixverse.ai/ | Video Generators | 95.6M | 146.6M | 51.0M | 53.39% | 5.73% |
| 7 | Runway | https://runwayml.com/ | Video Generators | 113.8M | 133.9M | 20.1M | 17.69% | 5.23% |
| 8 | Hailuo Minimax | https://hailuoai.video/ | Video Generators | 135.2M | 107.0M | -28.1M | -20.81% | 4.18% |
| 9 | Google Veo 3 | https://gemini.google/overview/video-generation/ | Video Generators | 10.2M | 82.7M | 72.5M | 711.07% | 3.23% |
| 10 | Vidnoz AI | https://www.vidnoz.com/ | Video Generators | 117.6M | 81.8M | -35.8M | -30.40% | 3.20% |
Video Generators were spread across dozens of competing AI tools, with no clear long-term winner. Music Generators look far more settled. Most web visits are already concentrated around two AI tools, and both continued to grow during the latest 12 months.
The visual below ranks the 10 most-visited AI Music Generators from May 2025 to April 2026 and compares their results with the previous year. Across the full category, web visits increased from 1.0 billion to 1.3 billion, a rise of 21.22%.
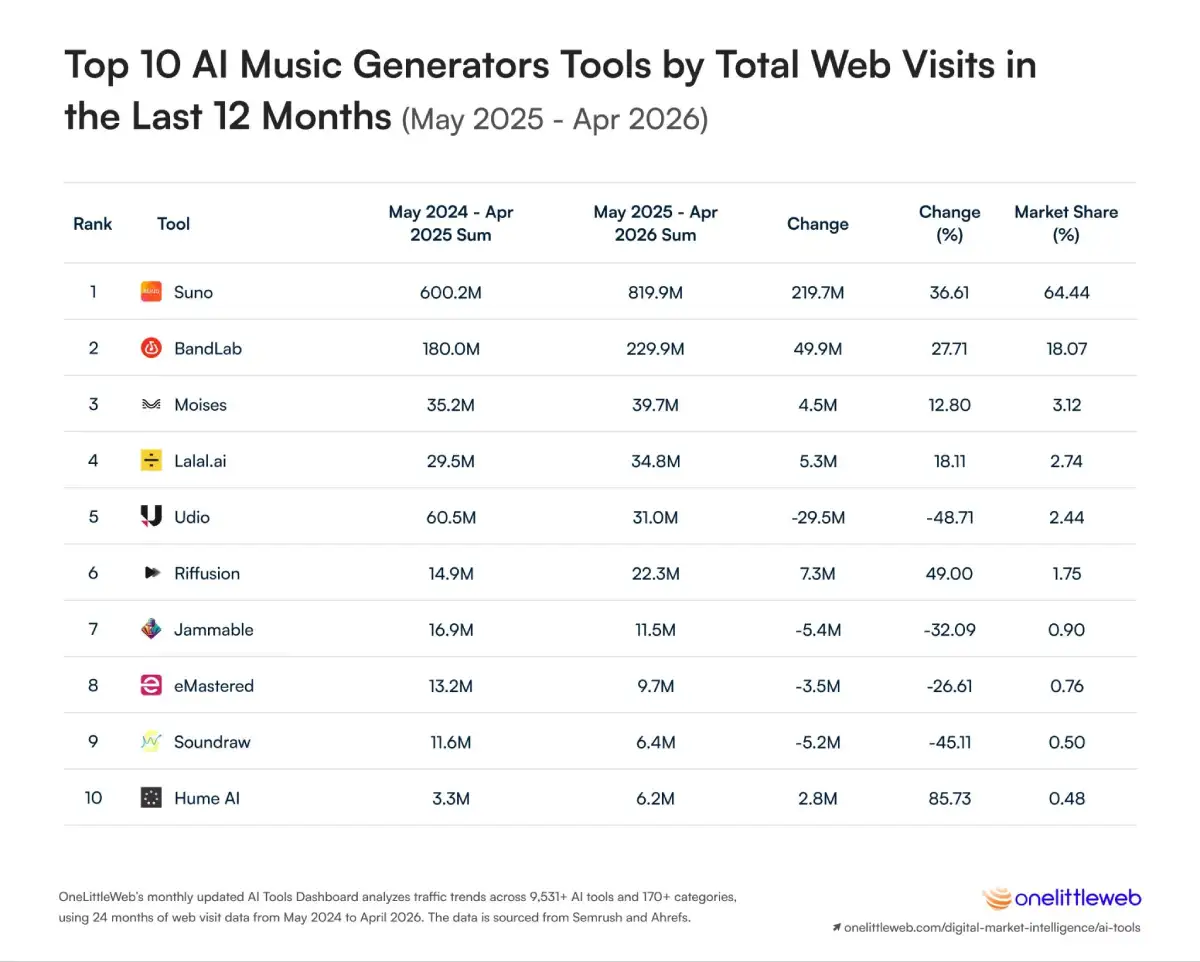
Suno remained firmly in first place with 819.9 million web visits, up 36.61% from the previous year. BandLab followed with 229.9 million visits, growing 27.71%. Together, the two AI tools captured 82.51% of all web visits in the Music Generators category.
Suno added 219.7 million web visits, equal to almost 99% of the Music Generators category’s total net gain of 222.7 million.
That does not mean Suno was the only AI tool growing. BandLab added 49.9 million visits, while Moises, Lalal.ai, Riffusion, and Hume AI all finished above their previous-year totals. But losses elsewhere offset much of those gains. Udio declined 48.71%, Soundraw fell 45.11%, and Jammable dropped 32.09%.
For readers, the pattern is fairly clear. Interest in AI music is growing, but the gains are not being shared evenly across the category. Suno is extending its lead, BandLab remains a strong second, and several smaller AI tools are struggling to hold onto web visits. Unlike AI video, where users are still moving quickly between newer tools, AI music is beginning to settle into a clearer hierarchy around a small group of leaders.
The full table below shows how that hierarchy is taking shape, comparing the Top 10 music generators by total web visits, year-over-year change, and category market share.
(may 2025 - apr 2026)
| Rank | Tool Name | URL | Category | may 2024–apr 2025 Sum | may 2025–apr 2026 Sum | Change | Change (%) | Market Share (%) |
|---|---|---|---|---|---|---|---|---|
| 1 | Suno | https://suno.com/ | Music Generators | 600.2M | 819.9M | 219.7M | 36.61% | 64.44% |
| 2 | BandLab | https://www.bandlab.com/ | Music Generators | 180.0M | 229.9M | 49.9M | 27.71% | 18.07% |
| 3 | Moises | https://moises.ai/ | Music Generators | 35.2M | 39.7M | 4.5M | 12.80% | 3.12% |
| 4 | Lalal.ai | https://www.lalal.ai/ | Music Generators | 29.5M | 34.8M | 5.3M | 18.11% | 2.74% |
| 5 | Udio | https://www.udio.com/ | Music Generators | 60.5M | 31.0M | -29.5M | -48.71% | 2.44% |
| 6 | Riffusion | https://www.riffusion.com/ | Music Generators | 14.9M | 22.3M | 7.3M | 49.00% | 1.75% |
| 7 | Jammable | https://www.jammable.com/ | Music Generators | 16.9M | 11.5M | -5.4M | -32.09% | 0.90% |
| 8 | eMastered | https://emastered.com/ | Music Generators | 13.2M | 9.7M | -3.5M | -26.61% | 0.76% |
| 9 | Soundraw | https://soundraw.io/ | Music Generators | 11.6M | 6.4M | -5.2M | -45.11% | 0.50% |
| 10 | Hume AI | https://www.hume.ai/ | Music Generators | 3.3M | 6.2M | 2.8M | 85.73% | 0.48% |
Music Generators showed us a category where most new web visits flowed to one fast-growing leader. Background Removers are even more concentrated, but this time the largest AI tool is slowly losing ground while newer alternatives grow around it.
The visual below ranks the 10 most-visited AI Background Removers from May 2025 to April 2026 and compares their results with the previous 12 months. Across the full category, web visits declined by 60.8 million, or 5.13%, falling from roughly 1.2 billion to 1.1 billion.
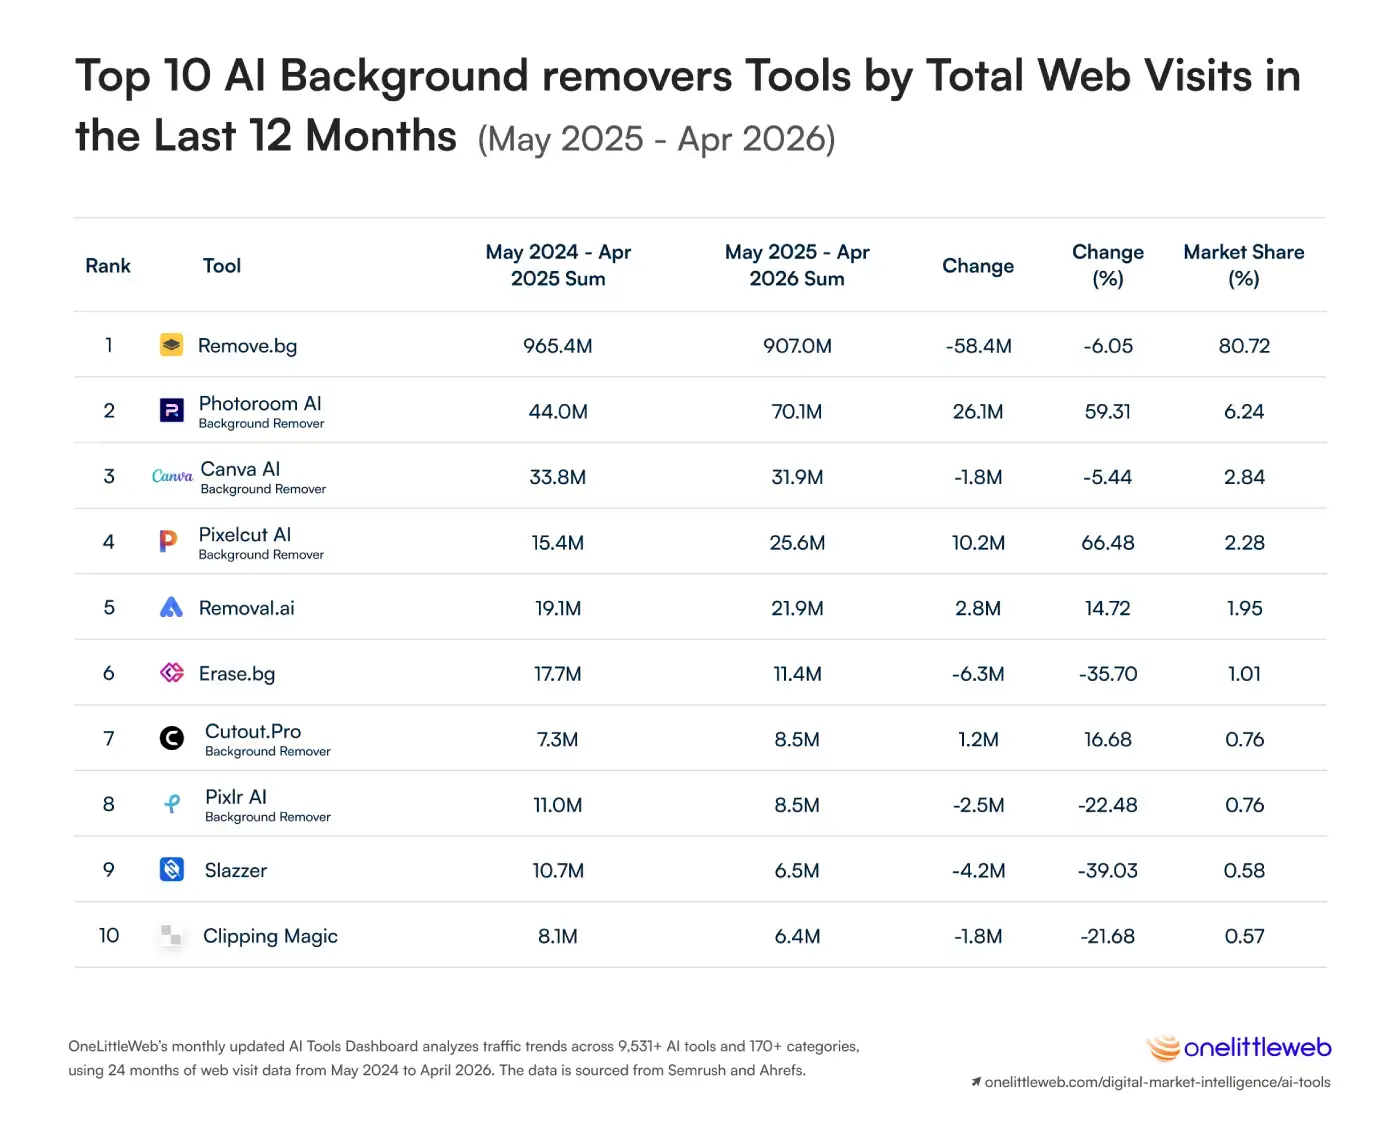
Remove.bg remained far ahead with 907.0 million web visits, capturing 80.72% of all web visits in the category. Yet its annual total fell by 58.4 million, or 6.05%, meaning the category’s overall decline came almost entirely from its largest AI tool.
Remove.bg accounted for 96% of the Background Removers category’s total loss in web visits. The category declined by 60.8 million visits, and Remove.bg alone lost 58.4 million.
Below the leader, the direction was more encouraging. Photoroom’s AI Background Remover grew 59.31% to 70.1 million web visits, while Pixelcut increased 66.48% to 25.6 million. Removal.ai and Cutout.Pro also finished above their previous-year totals.
That creates a more layered picture than the category total first suggests. People are not necessarily abandoning background removal. Instead, some web visits appear to be shifting away from a single-purpose AI tool and toward background-removal features built inside broader image-editing products such as Photoroom and Pixelcut.
For users, that makes practical sense. Removing a background is often only one step in a larger design task. When the same AI tool can remove the background, resize the image, add text, create product visuals, and export the final result, there is less reason to visit a separate website for one action alone. Remove.bg still dominates the category, but the growth is now coming from AI tools that support a broader creative workflow.
The full table below shows how that shift is developing, comparing the Top 10 Background Removers by total web visits, year-over-year change, and category market share.
(may 2025 - apr 2026)
| Rank | Tool Name | URL | Category | may 2024–apr 2025 Sum | may 2025–apr 2026 Sum | Change | Change (%) | Market Share (%) |
|---|---|---|---|---|---|---|---|---|
| 1 | Remove.bg | https://www.remove.bg/ | Background Removers | 965.4M | 907.0M | -58.4M | -6.05% | 80.72% |
| 2 | Photoroom AI Background Remover | https://www.photoroom.com/tools/background-remover | Background Removers | 44.0M | 70.1M | 26.1M | 59.31% | 6.24% |
| 3 | Canva AI Background Remover | https://www.canva.com/features/background-remover/ | Background Removers | 33.8M | 31.9M | -1.8M | -5.44% | 2.84% |
| 4 | Pixelcut AI Background Remover | https://www.pixelcut.ai/background-remover | Background Removers | 15.4M | 25.6M | 10.2M | 66.48% | 2.28% |
| 5 | Removal.ai | https://removal.ai/ | Background Removers | 19.1M | 21.9M | 2.8M | 14.72% | 1.95% |
| 6 | Erase.bg | https://www.erase.bg/ | Background Removers | 17.7M | 11.4M | -6.3M | -35.70% | 1.01% |
| 7 | Cutout.Pro Remove Background | https://www.cutout.pro/remove-background | Background Removers | 7.3M | 8.5M | 1.2M | 16.68% | 0.76% |
| 8 | Pixlr AI Background Remover | https://pixlr.com/remove-background/ | Background Removers | 11.0M | 8.5M | -2.5M | -22.48% | 0.76% |
| 9 | Slazzer | https://www.slazzer.com/ | Background Removers | 10.7M | 6.5M | -4.2M | -39.03% | 0.58% |
| 10 | Clipping Magic | https://clippingmagic.com/ | Background Removers | 8.1M | 6.4M | -1.8M | -21.68% | 0.57% |
Background Removers showed how a category can decline when most web visits depend on one dominant AI tool. Sales Tools follow a similar pattern, but the way people use enterprise software makes the story more nuanced.
The visual below ranks the 10 most-visited AI Sales Tools from May 2025 to April 2026 and compares their results with the previous 12 months. Unlike consumer AI tools, sales software often grows through company contracts, team accounts, and existing customer relationships rather than sudden public interest. That usually makes shifts in web visits slower and less dramatic.
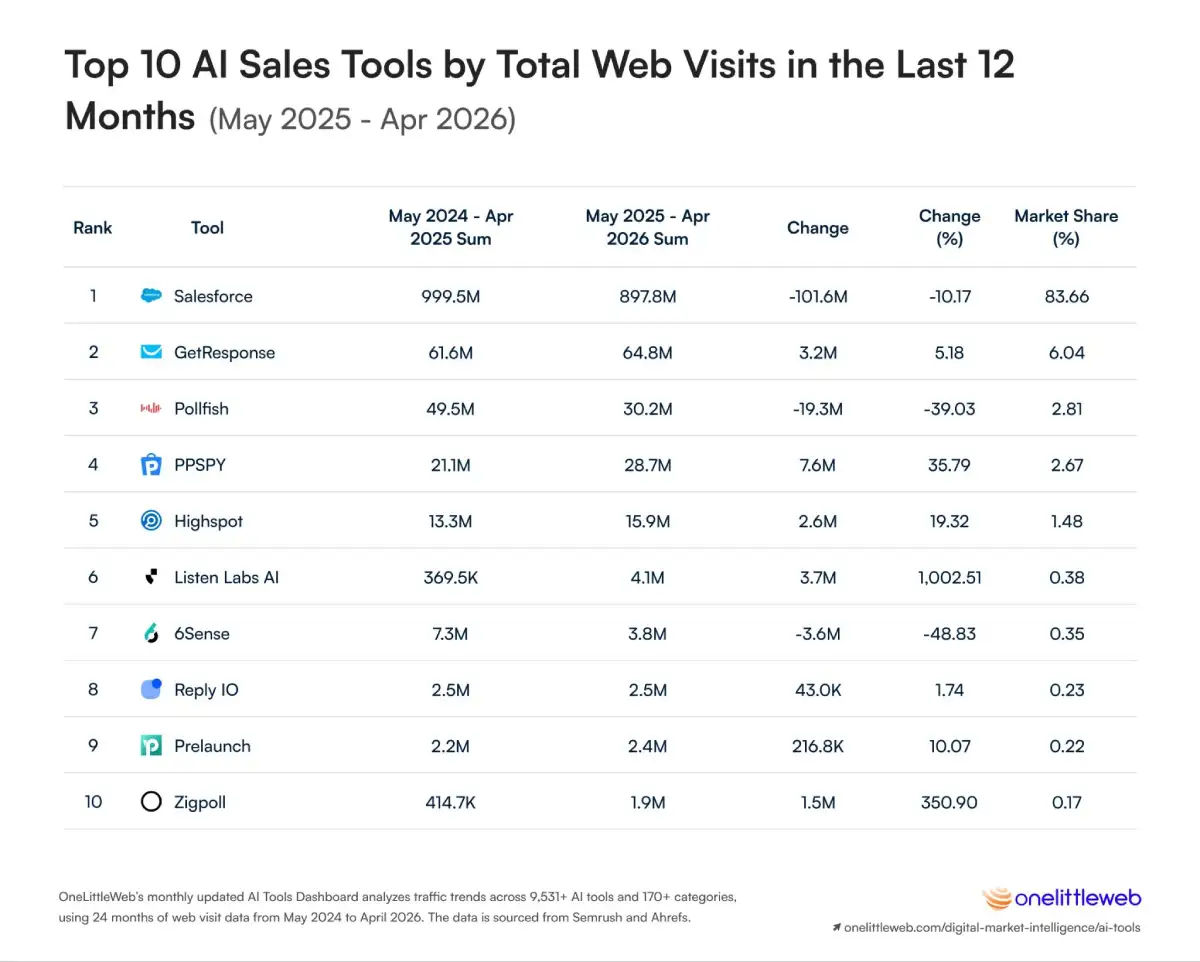
Salesforce remained far ahead with 897.8 million web visits, capturing 83.66% of all web visits in the category. However, its annual total fell by 101.6 million visits, or 10.17%. GetResponse ranked second with 64.8 million visits, while Pollfish followed with 30.2 million.
Salesforce lost 101.6 million web visits, more than five times the combined 18.9 million visits added by all seven growing Sales Tools in the Top 10.
That finding explains why the smaller success stories could not change the direction of the category. PPSPY grew 35.79%, Highspot increased 19.32%, and GetResponse added 5.18%, but their gains were too small to offset the decline at the top.
The fastest growth came from much smaller AI tools. Listen Labs AI rose 1,002.51%, from just 369,500 to 4.1 million web visits, while Zigpoll increased 350.90% to 1.9 million. These are striking growth rates, but the totals remain small compared with Salesforce.
In practical terms, the Sales Tools category is not yet being reshaped by its fastest-growing AI tools. Newer names are gaining web visits, but the category still moves largely with Salesforce because of its overwhelming size. We should read that decline carefully, though. Fewer public web visits do not necessarily mean companies are using Salesforce less, since much of its activity happens inside logged-in products, team accounts, and long-term business contracts. What the data does show is that public web visits to Sales Tools are not growing at the same pace as many consumer-facing AI categories.
The full table below shows how concentrated the category remains, comparing the top 10 sales tools by total web visits, year-over-year change, and category market share.
(may 2025 - apr 2026)
| Rank | Tool Name | URL | Category | may 2024–apr 2025 Sum | may 2025–apr 2026 Sum | Change | Change (%) | Market Share (%) |
|---|---|---|---|---|---|---|---|---|
| 1 | Salesforce | https://www.salesforce.com/in/?ir=1 | Sales Tools | 999.5M | 897.8M | -101.6M | -10.17% | 83.66% |
| 2 | GetResponse | https://www.getresponse.com/ | Sales Tools | 61.6M | 64.8M | 3.2M | 5.18% | 6.04% |
| 3 | Pollfish | https://www.pollfish.com/ | Sales Tools | 49.5M | 30.2M | -19.3M | -39.03% | 2.81% |
| 4 | PPSPY | https://www.ppspy.com/ | Sales Tools | 21.1M | 28.7M | 7.6M | 35.79% | 2.67% |
| 5 | Highspot | https://www.highspot.com/ | Sales Tools | 13.3M | 15.9M | 2.6M | 19.32% | 1.48% |
| 6 | Listen Labs AI | https://listenlabs.ai/ | Sales Tools | 369.5K | 4.1M | 3.7M | 1,002.51% | 0.38% |
| 7 | 6Sense | https://6sense.com/ | Sales Tools | 7.3M | 3.8M | -3.6M | -48.83% | 0.35% |
| 8 | Reply IO | https://reply.io/ | Sales Tools | 2.5M | 2.5M | 43.0K | 1.74% | 0.23% |
| 9 | Prelaunch | https://prelaunch.com/ | Sales Tools | 2.2M | 2.4M | 216.8K | 10.07% | 0.22% |
| 10 | Zigpoll | https://www.zigpoll.com/ | Sales Tools | 414.7K | 1.9M | 1.5M | 350.90% | 0.17% |
After looking at the largest AI tool categories, we now know where most web visits are concentrated. But size alone does not tell us which parts of the market are gaining momentum. A category can remain large while losing visits, while a smaller one can grow quickly enough to change the competitive picture.
In this section, we compare web visits from May 2025 to April 2026 with the previous 12 months to identify the AI tools and categories that added the most visits, those with the fastest percentage growth, and those that recorded the largest declines.
We will look at both absolute and percentage change because they tell different stories. A large AI tool may add billions of visits with a moderate growth rate, while a newer tool may grow several hundred percent from a much smaller starting point. Reading both together helps us separate real market scale from early momentum and see where user attention is actually moving.
The category rankings showed us where the largest audiences already exist. Now we can see where the market’s new web visits actually came from.
The visual below ranks AI tool categories by the absolute number of web visits added compared with the previous 12 months. This is different from ranking by percentage growth. Larger categories naturally have more room to add billions of visits, while smaller categories can grow much faster in percentage terms without yet reaching the same scale.
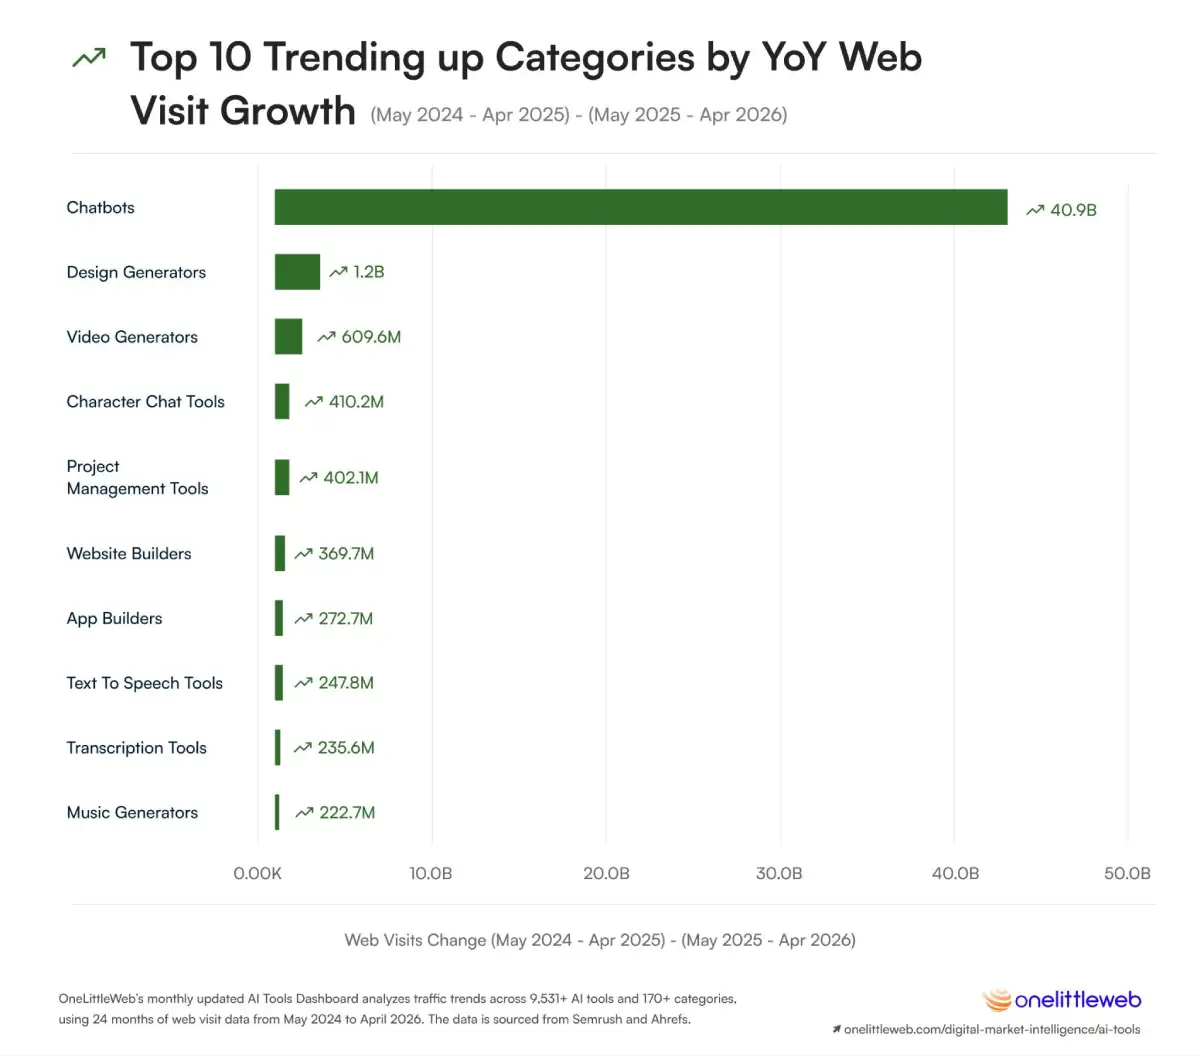
Chatbots were not simply the largest category. They were responsible for most of the market’s expansion. Web visits rose from 45.1 billion to 86.0 billion, an increase of 40.9 billion, or 90.82%.
Chatbots accounted for roughly 91% of all web visits added across the 10 leading growth categories. They gained more than 34 times as many visits as Design Generators, the category in second place.
Design Generators added 1.2 billion web visits, followed by Video Generators with 609.6 million. Character Chat Tools and Project Management Tools gained 410.2 million and 402.1 million, respectively.
When we look further down the table, a different kind of growth appears. Website builders more than doubled, rising 109.74% from 336.9 million to 706.7 million web visits. Transcription tools grew 88.84%, while app builders increased 81.91%.
These smaller categories did not add as many visits as chatbots, but their growth tells us where new AI habits may be forming. People are increasingly using AI not only to ask questions but also to build websites and apps, transcribe recordings, generate speech, manage work, and create media.
In human terms, the AI tools market is growing in two layers. Chatbots are driving most of the new web visits today, while smaller creation and productivity categories are expanding quickly enough to become much more important in future rankings.
The full table below brings those gains together, ranking the 10 AI tool categories that added the most web visits from May 2025 to April 2026 and comparing their absolute growth, percentage growth, and total web visits.
(may 2024 - apr 2025) - (may 2025 - apr 2026)
| Rank | Category | may 2024–apr 2025 Sum | may 2025–apr 2026 Sum | Change | Change (%) |
|---|---|---|---|---|---|
| 1 | Chatbots | 45.1B | 86.0B | 40.9B | 90.82% |
| 2 | Design Generators | 9.6B | 10.9B | 1.2B | 12.87% |
| 3 | Video Generators | 2.0B | 2.6B | 609.6M | 31.24% |
| 4 | Character Chat Tools | 3.1B | 3.5B | 410.2M | 13.20% |
| 5 | Project Management Tools | 2.2B | 2.6B | 402.1M | 18.55% |
| 6 | Website Builders | 336.9M | 706.7M | 369.7M | 109.74% |
| 7 | App Builders | 332.9M | 605.6M | 272.7M | 81.91% |
| 8 | Text-to-Speech Tools | 669.3M | 917.1M | 247.8M | 37.03% |
| 9 | Transcription Tools | 265.2M | 500.9M | 235.6M | 88.84% |
| 10 | Music Generators | 1.0B | 1.3B | 222.7M | 21.22% |
The growth ranking showed us where new web visits were flowing. Now we turn to the other side of the market and look at the categories that lost the most ground.
The visual below ranks AI tool categories by their absolute decline in web visits compared with the previous 12 months. Looking at the raw loss helps us see which established use cases are shrinking at a meaningful scale, rather than focusing only on percentage declines from smaller categories.
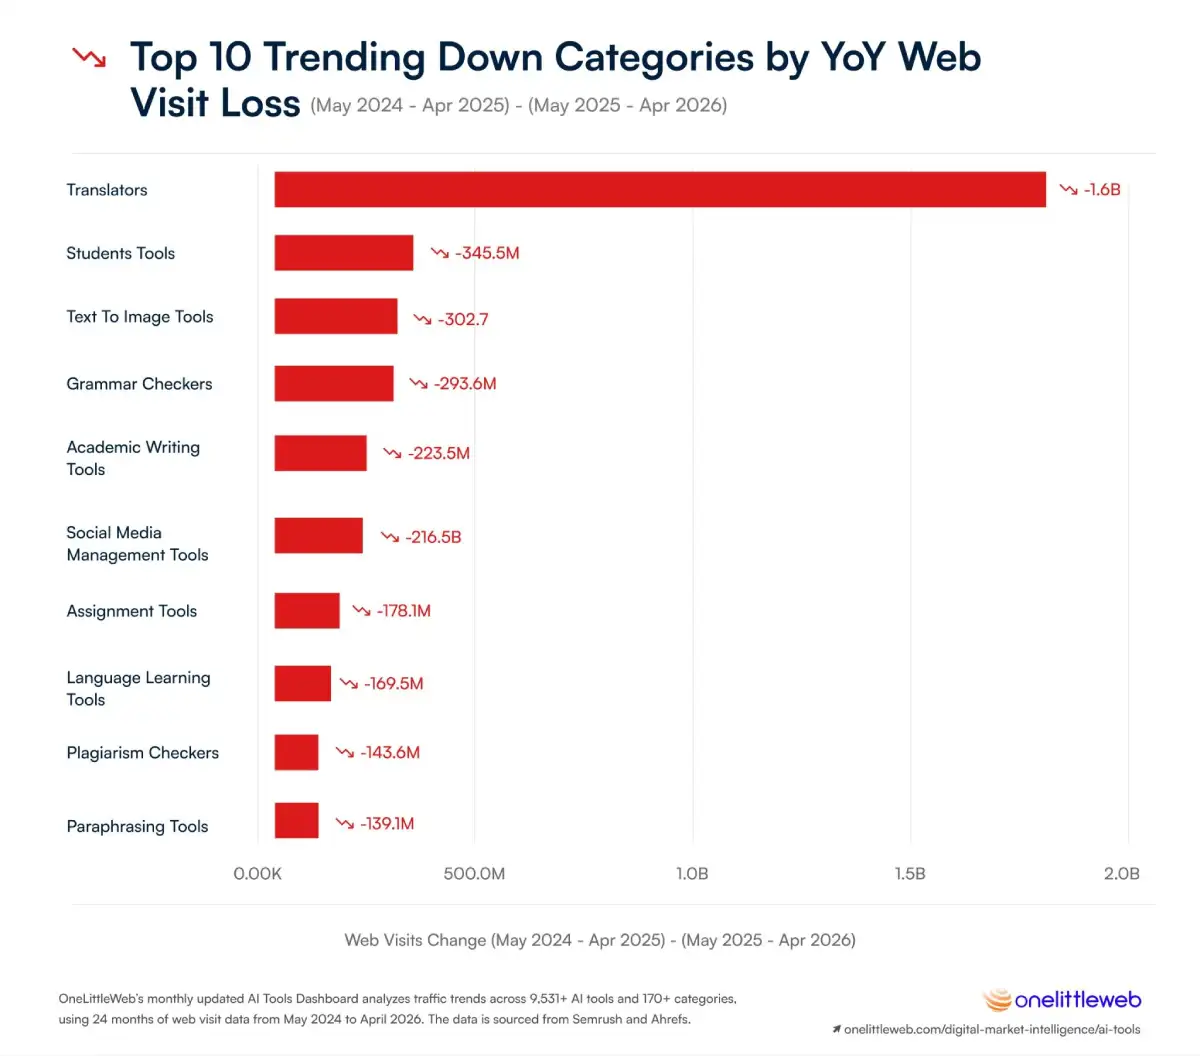
Translators recorded the largest loss, falling from 7.3 billion to 5.7 billion web visits. That meant a decline of 1.6 billion visits, or 22.52%, far more than any other category in absolute terms.
But the wider pattern is even more revealing.
Six of the 10 fastest-declining categories directly serve students, writers, or academic work. Together, Students’ Tools, Grammar Checkers, Academic Writing Tools, Assignment Tools, Language Learning Tools, and Paraphrasing Tools lost roughly 1.35 billion web visits.
Students’ Tools lost 345.5 million visits, Text-to-Image Tools fell by 302.7 million, and Grammar Checkers declined by 293.6 million. Academic Writing Tools followed with a loss of 223.5 million, while Social Media Management Tools dropped by 216.5 million.
Assignment Tools recorded the sharpest percentage decline in the entire list, falling 60.49% from 294.4 million to 116.3 million web visits. Paraphrasing tools declined 37.44%, while plagiarism checkers and social media management tools each lost just over 35%.
In human terms, the data suggests that many users are no longer visiting a separate AI tool for each narrow task. Translation, grammar correction, paraphrasing, assignment help, and language support can now happen inside broader AI tools that keep the full conversation in one place.
That does not mean these tasks are disappearing. It means the web visit may be moving. Instead of opening several specialized websites, users can ask one general-purpose AI tool to translate, rewrite, explain, summarize, and answer follow-up questions without switching tabs.
Text-to-Image Tools are the main exception to this academic pattern. Their 302.7 million-visit decline suggests that creative categories can lose ground too, especially as users move toward newer Image Generators or create images inside broader design and chatbot tools.
The full table below brings these declines together, ranking the 10 AI tool categories that lost the most web visits from May 2025 to April 2026 and comparing their absolute and percentage changes.
(may 2024 - apr 2025) - (may 2025 - apr 2026)
| Rank | Category | may 2024–apr 2025 Sum | may 2025–apr 2026 Sum | Web Visits Change (-) | Change (%) |
|---|---|---|---|---|---|
| 1 | Translators | 7.3B | 5.7B | -1.6B | -22.52% |
| 2 | Students' Tools | 1.2B | 819.2M | -345.5M | -29.66% |
| 3 | Text-to-Image Tools | 829.4M | 526.7M | -302.7M | -36.50% |
| 4 | Grammar Checkers | 1.3B | 1.0B | -293.6M | -22.38% |
| 5 | Academic Writing Tools | 901.6M | 678.1M | -223.5M | -24.79% |
| 6 | Social Media Management Tools | 614.0M | 397.4M | -216.5M | -35.27% |
| 7 | Assignment Tools | 294.4M | 116.3M | -178.1M | -60.49% |
| 8 | Language Learning Tools | 890.5M | 721.0M | -169.5M | -19.03% |
| 9 | Plagiarism Checkers | 409.4M | 265.7M | -143.6M | -35.09% |
| 10 | Paraphrasing Tools | 371.6M | 232.5M | -139.1M | -37.44% |
The category data showed that chatbots were responsible for most of the AI market’s growth. When we move from categories to individual AI tools, that concentration becomes even clearer.
The visual below ranks the 10 AI tools that added the most web visits compared with the previous 12 months. We are ranking them by the actual number of visits gained, not by percentage growth, so the results show which AI tools contributed most to the market’s expansion at scale.
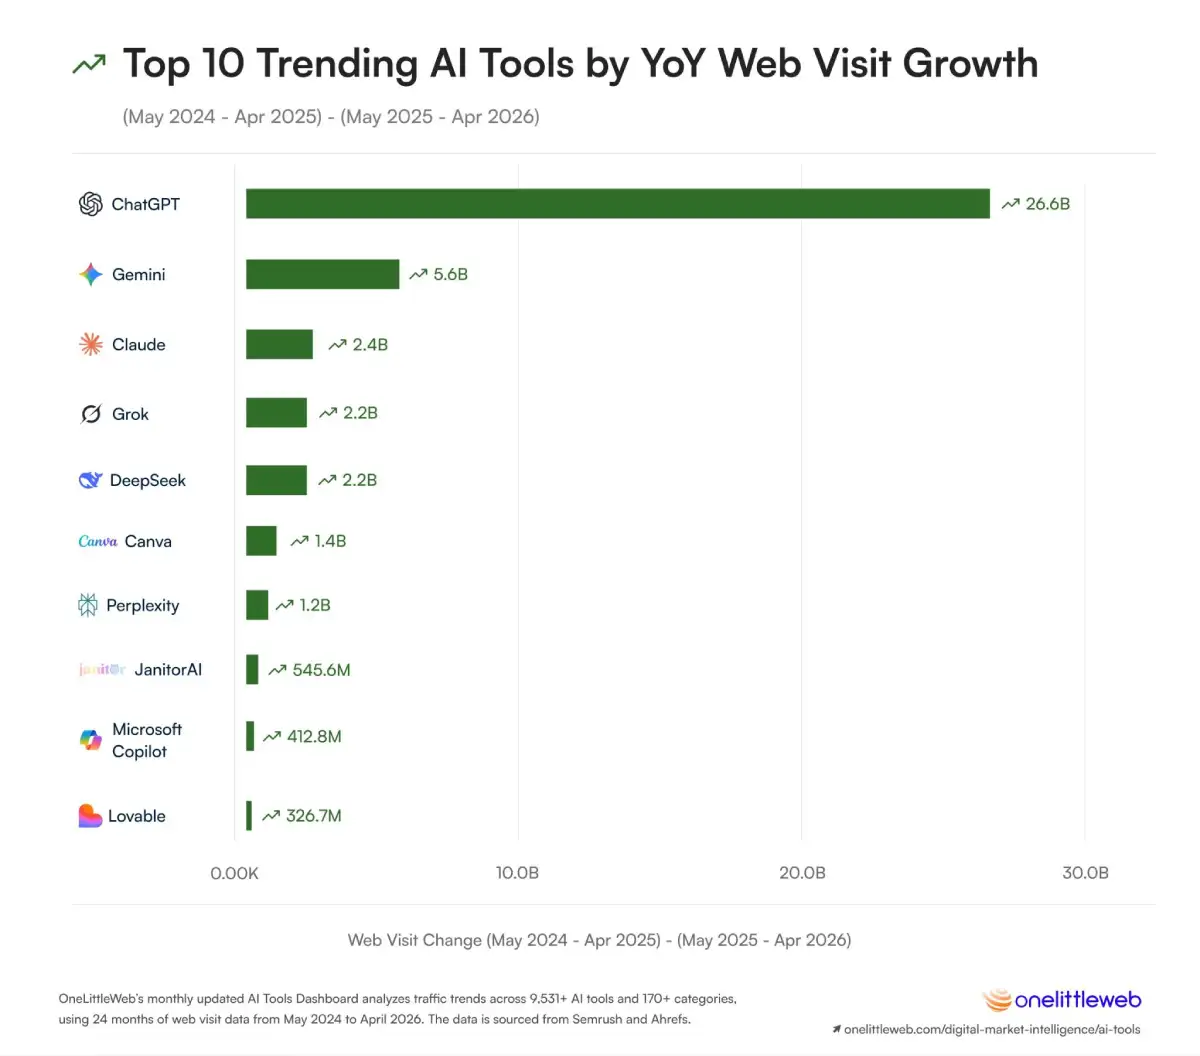
ChatGPT led by an extraordinary margin, adding 26.6 billion web visits as its annual total rose from 38.1 billion to 64.7 billion. Gemini ranked second with an increase of 5.6 billion, followed by Claude at 2.4 billion, Grok at 2.2 billion, and DeepSeek at 2.2 billion.
ChatGPT added more web visits than the other nine fastest-growing AI tools combined. It gained 26.6 billion visits, compared with roughly 16.2 billion across the rest of the Top 10.
Seven of the 10 AI tools on the list were chatbots. Together, they added roughly 40.5 billion web visits, accounting for about 94.7% of all visits gained by the Top 10. This helps explain why chatbot growth now shapes the direction of the entire AI tools market.
The ranking also shows why absolute growth and percentage growth need to be read together. Grok grew 731.26%, while Lovable recorded the highest percentage increase at 851.55%. Yet Lovable added 326.7 million web visits, compared with ChatGPT’s 26.6 billion. Both results are strong, but they represent very different levels of market impact.
Canva was the largest non-chatbot contributor, adding 1.4 billion web visits, while JanitorAI gained 545.6 million. Their presence shows that growth is not limited entirely to general-purpose assistants, but the gap is substantial.
In human terms, most new AI tool web visits are flowing toward tools that can handle several needs in one place. People are increasingly turning to chatbots for writing, research, coding, translation, planning, and everyday questions rather than opening a separate AI tool for each task. Creative and website-building AI tools are growing too, but their gains remain much smaller than the expansion happening across conversational AI.
The full table below brings those gains together, ranking the 10 AI tools that added the most web visits from May 2025 to April 2026 and comparing their previous and current totals, absolute gains, and year-over-year growth.
(may 2024 - apr 2025) - (may 2025 - apr 2026)
| Rank | AI Tool | Category | may 2024–apr 2025 Sum | may 2025–apr 2026 Sum | Change | Change (%) |
|---|---|---|---|---|---|---|
| 1 | ChatGPT | Chatbots | 38.1B | 64.7B | 26.6B | 69.80% |
| 2 | Gemini | Chatbots | 1.3B | 6.9B | 5.6B | 450.33% |
| 3 | Claude | Chatbots | 958.0M | 3.4B | 2.4B | 250.07% |
| 4 | Grok | Chatbots | 297.7M | 2.5B | 2.2B | 731.26% |
| 5 | DeepSeek | Chatbots | 1.7B | 3.8B | 2.2B | 129.10% |
| 6 | Canva | Design Generators | 9.1B | 10.5B | 1.4B | 15.54% |
| 7 | Perplexity | Chatbots | 1.2B | 2.3B | 1.2B | 98.38% |
| 8 | JanitorAI | Character Chat Tools | 1.0B | 1.6B | 545.6M | 53.14% |
| 9 | Microsoft Copilot | Chatbots | 795.9M | 1.2B | 412.8M | 51.87% |
| 10 | Lovable | Website Builders | 38.4M | 365.0M | 326.7M | 851.55% |
The previous ranking showed where new web visits were concentrating. This one reveals which AI tools were left behind as user attention shifted elsewhere.
The visual below ranks the 10 AI tools with the largest absolute declines compared with the previous 12 months. We focus on the number of web visits lost rather than percentage change alone, since a modest decline at a large AI tool can remove far more visits from the market than a sharper fall at a smaller one.
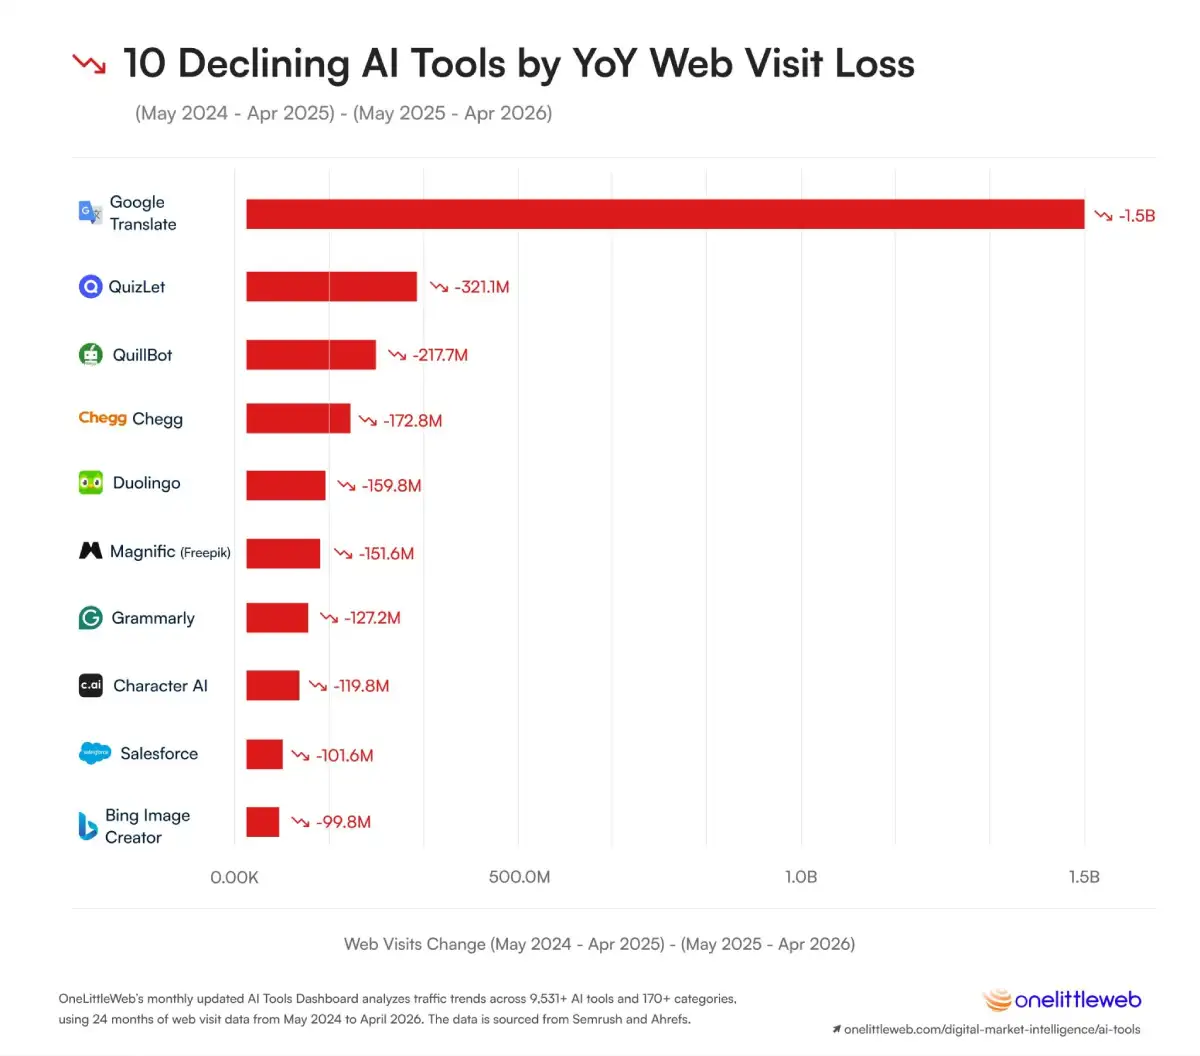
Together, these 10 AI tools lost nearly 3.0 billion web visits. Google Translate accounted for the largest share, falling from 6.2 billion to 4.8 billion visits, a loss of 1.5 billion, or 23.46%.
Google Translate alone accounted for about half of all web visits lost across the 10 fastest-declining AI tools.
Quizlet ranked second by absolute loss, dropping 321.1 million visits, followed by QuillBot with 217.7 million. Chegg lost 172.8 million visits, while Duolingo declined by 159.8 million. Six of the 10 AI tools on this list are closely tied to translation, studying, writing, grammar, or language learning.
Chegg recorded the steepest percentage decline, falling 61.45% from 281.2 million to 108.4 million web visits. Bing Image Creator followed with a 54.54% decline, while Quizlet and QuillBot fell 29.09% and 25.24%, respectively.
In human terms, the tasks behind these AI tools have not disappeared. People still translate text, check grammar, study languages, prepare assignments, and rewrite content. What may be changing is where they do those things.
A user who once opened separate websites for translation, paraphrasing, grammar correction, and homework help can now complete several of those tasks inside one broader AI tool. The data cannot prove that every lost visit moved to ChatGPT, Gemini, or Claude, but the timing is hard to ignore. General-purpose chatbots gained tens of billions of web visits while many single-purpose education and language tools moved backward.
That helps explain why the winners and losers in our study look so different. The strongest growth came from AI tools that support many tasks in one place, while much of the decline came from tools built around one narrow action.
The full table below brings those losses together, ranking the 10 AI tools that lost the most web visits from May 2025 to April 2026 and comparing their previous and current totals, absolute decline, and year-over-year change.
(may 2024 - apr 2025) - (may 2025 - apr 2026)
| Rank | AI Tool | Category | may 2024–apr 2025 Sum | may 2025–apr 2026 Sum | Web Visits Change (-) | Web Visits Change (%) |
|---|---|---|---|---|---|---|
| 1 | Google Translate | Translators | 6.2B | 4.8B | -1.5B | -23.46% |
| 2 | Quizlet | Students' Tools | 1.1B | 782.7M | -321.1M | -29.09% |
| 3 | QuillBot | Academic Writing Tools | 862.6M | 644.9M | -217.7M | -25.24% |
| 4 | Chegg | Assignment Tools | 281.2M | 108.4M | -172.8M | -61.45% |
| 5 | Duolingo | Language Learning Tools | 780.7M | 620.9M | -159.8M | -20.47% |
| 6 | Magnific (Freepik) | Image Generators | 2.0B | 1.8B | -151.6M | -7.77% |
| 7 | Grammarly | Grammar Checkers | 823.2M | 696.0M | -127.2M | -15.45% |
| 8 | Character AI | Character Chat Tools | 1.9B | 1.7B | -119.8M | -6.47% |
| 9 | Salesforce | Sales Tools | 999.5M | 897.8M | -101.6M | -10.17% |
| 10 | Bing Image Creator | Text-to-Image Tools | 182.9M | 83.1M | -99.8M | -54.54% |
So far, we have looked at which AI tools and categories attract the most web visits. But market size alone does not tell us how deeply AI has been adopted in different parts of the world.
Total web visits naturally favor countries with larger populations. The United States may generate far more AI tool web visits than Singapore or the Netherlands, but that does not necessarily mean AI is used more intensively there. A country with hundreds of millions of people will almost always produce a larger total than one with only a few million residents.
That is why we decided to zoom in further.
Instead of ranking countries only by total AI tool web visits, we calculated the number of visits per 100,000 people. This gave us a more meaningful way to compare countries of very different sizes and see where AI use appears most deeply embedded relative to the population.
The distinction matters. Total web visits show us where the largest AI audience exists, while visits per 100,000 people reveal adoption intensity. Once we adjusted for population, several smaller countries moved ahead of the world’s largest markets.
The visual below shows that AI adoption is not simply a story of population or economic size. It is also about how frequently people in each country are turning to AI tools as part of their everyday internet use.
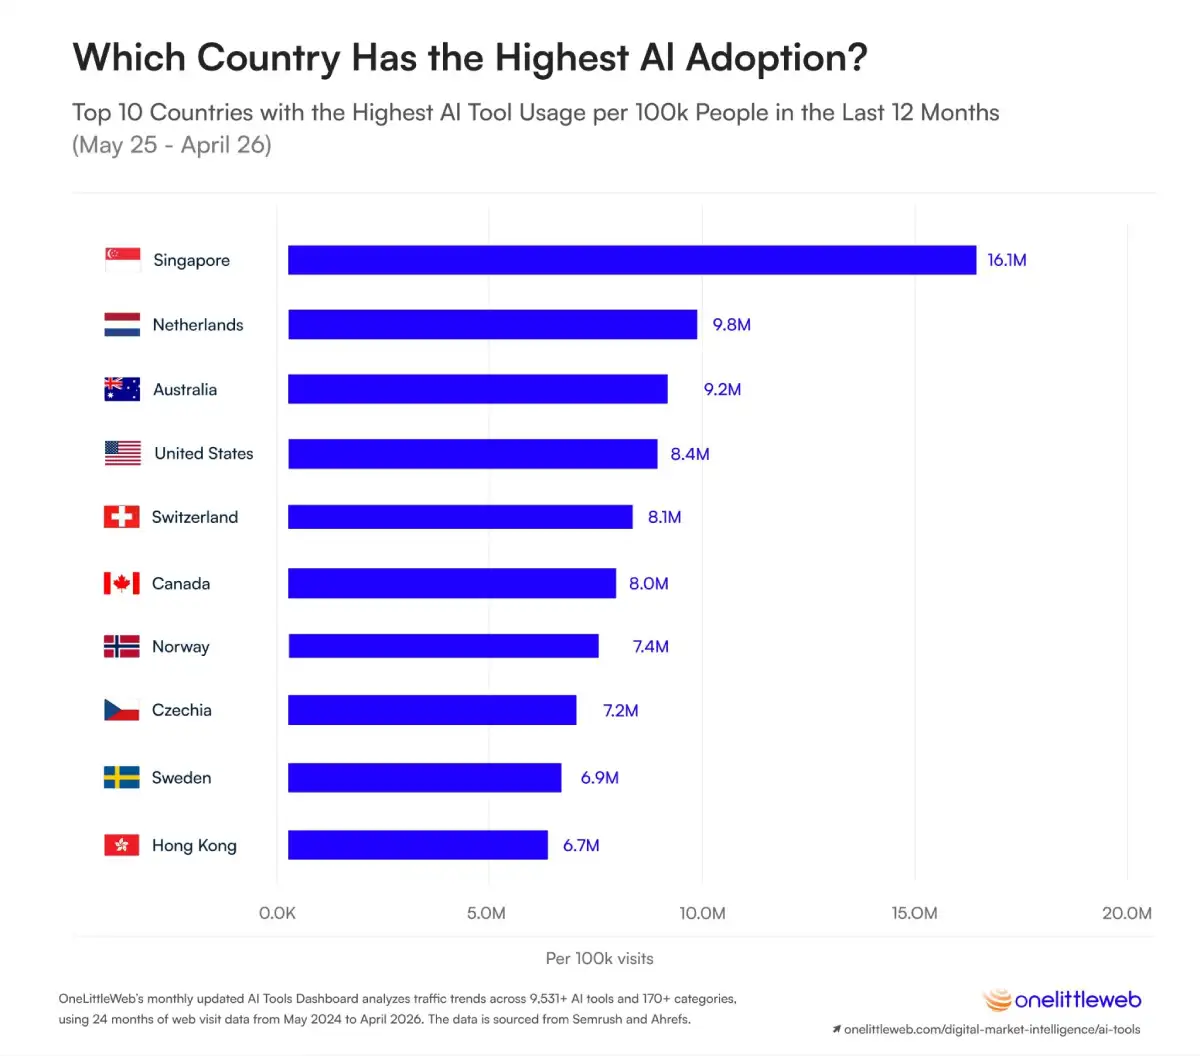
Once we adjusted AI tool web visits for population, the ranking changed dramatically. The countries generating the most total visits were not always the ones where AI use was most deeply embedded. Smaller countries such as Singapore, the Netherlands, Switzerland, Norway, and Sweden moved ahead of much larger markets when we measured web visits per 100,000 people.
Singapore stood out most clearly. It generated 16.1 million AI tool web visits per 100,000 people, nearly twice the 8.4 million recorded in the United States. The U.S. still led in total volume with 29.2 billion visits, while Singapore generated 950.8 million, but the population-adjusted view tells us that AI use was far more intense in Singapore.
Seven of the Top 10 countries had populations below 20 million, showing that the deepest AI adoption is not limited to the world’s largest markets.
This is the real value of looking beyond total web visits. A large population can make a country appear dominant, even when AI use is less common relative to the number of people living there. By measuring visits per 100,000 residents, we can see where AI tools have become a more regular part of everyday internet behavior.
The ranking suggests that AI adoption depends on more than market size. Smaller countries can move ahead when AI use is widespread across the population, even if their total web visits remain far below those of larger markets. The United States still leads in total AI tool web visits, but Singapore shows what deeper adoption looks like once population is taken into account.
The full table below brings that comparison together, ranking countries by AI tool web visits per 100,000 people and showing their population, total web visits, adoption intensity, and year-over-year growth.
Top 10 Countries with the Highest AI Tool Usage per 100K People in the Last 12 Months (may 2025 - apr 2026)
| Rank | Country | Population | may 2024–apr 2025 Sum | may 2025–apr 2026 Sum | Visits per 100K People | Change (may 2024 - apr 2025) to (may 2025 - apr 2026) | Change (%) may 2024 - apr 2025) to (may 2025 - apr 2026) |
|---|---|---|---|---|---|---|---|
| 1 | Singapore | 5.9M | 726.8M | 950.8M | 16.1M | 224.0M | 30.83% |
| 2 | Netherlands | 18.4M | 1.2B | 1.8B | 9.8M | 601.0M | 50.23% |
| 3 | Australia | 27.2M | 1.7B | 2.5B | 9.2M | 766.9M | 44.15% |
| 4 | United States | 349.0M | 22.1B | 29.2B | 8.4M | 7.1B | 32.33% |
| 5 | Switzerland | 9.0M | 498.7M | 731.1M | 8.1M | 232.4M | 46.59% |
| 6 | Canada | 40.5M | 2.4B | 3.2B | 8.0M | 848.3M | 35.50% |
| 7 | Norway | 5.7M | 323.0M | 424.1M | 7.4M | 101.1M | 31.30% |
| 8 | Czech Republic | 10.5M | 458.6M | 755.5M | 7.2M | 296.9M | 64.75% |
| 9 | Sweden | 10.7M | 526.7M | 735.1M | 6.9M | 208.4M | 39.57% |
| 10 | Hong Kong | 7.4M | 345.7M | 497.7M | 6.7M | 151.9M | 43.94% |
After looking at the tools, categories, growth patterns, and country-level adoption, one message stands out clearly: AI use is expanding quickly, but that growth is becoming concentrated around a smaller group of AI tools.
Across the 9,531 AI tools in our study, web visits reached 144.5 billion over the latest 12 months, up 40.12% year over year. Yet the Top 100 AI tools generated 129.6 billion visits and held an 89.69% market share of all AI tool web visits we tracked. In other words, the market is growing, but most of that growth is flowing to the same leading names.
ChatGPT remains the clearest example. With 64.7 billion web visits, it captured 44.76% of the entire AI tools market on its own. At the same time, Gemini, Claude, Grok, DeepSeek, and Perplexity showed that the competitive gap is not standing still. Several challengers are growing rapidly, even if none has yet come close to matching ChatGPT’s scale.
The category data tells a similar story. Chatbots now account for more than half of all AI tool web visits, while several specialized categories, including translators, grammar checkers, academic writing tools, and student tools, are losing ground. That does not necessarily mean people need these tasks less. It suggests they are increasingly completing them inside broader AI tools instead of visiting a separate website for each action.
The country analysis adds another layer. The United States remains the largest AI market by total web visits, but Singapore leads when we adjust for population. Measuring visits per 100,000 people helped us see where AI use is most deeply embedded, not just where the largest audience lives.
So where does that leave the market?
AI already feels like a major part of the internet, yet it still represents only 4.20% of all web visits across the 10,173 websites in OneLittleWeb’s wider dataset. That means AI is both large and still early. The next phase will be shaped less by how many new tools appear and more by which ones become part of people’s daily routines, absorb more use cases, and give users a reason to keep coming back.
This study tracked how people actually used AI tools over the past year, based on real-world web visit data across the global AI industry.
The OneLittleWeb AI Tools Dashboard analyzed 9,531 AI tools across more than 170 categories, using 24 months of web visit data (May 2024 – April 2026).
The analysis compares two rolling 12-month windows, May 2024-April 2025 against May 2025-April 2026, rather than fixed calendar years. This captures the most current read on usage and growth rather than a picture frozen at year-end.
Web visit data was gathered and analyzed using Semrush and Ahrefs covering:
To measure adoption by country, AI web visits were compared against national population figures to calculate visits per 100,000 people.
What this study doesn’t fully capture:
Because the AI industry moves quickly, rankings and market positions may shift as new platforms emerge and usage patterns evolve.
Cost Savings
Premium Links
Book a call to discuss how we can help you dominate competitive and high search volume keywords while keeping the cost low.
They are solid people who run a quality service and always deliver. Highly dependable and honest.

Founder, DeepAI
Find out what’s wrong with your site in 2 business days
They are solid people who run a quality service and always deliver. Highly dependable and honest.
Founder, DeepAI
